The Practice of Statistics for AP - 4th Edition
4th Edition
ISBN: 9781429245593
Author: Starnes, Daren S., Yates, Daniel S., Moore, David S.
Publisher: Macmillan Higher Education
bartleby

Concept explainers

bartleby

Videos

Question
Book Icon
Chapter 10.2, Problem 51E

(a)

To determine

To Write: a few lines comparing, on the basis of graph and numerical summaries, the DRP scores for the two groups.

(a)

Expert Solution
Check Mark

Explanation of Solution

Given:

  The Practice of Statistics for AP - 4th Edition, Chapter 10.2, Problem 51E , additional homework tip  1The Practice of Statistics for AP - 4th Edition, Chapter 10.2, Problem 51E , additional homework tip  2

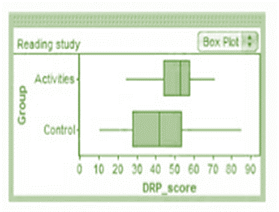
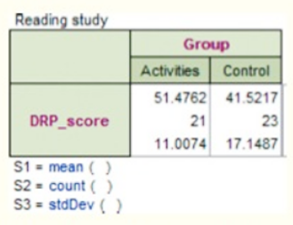
The Activity Centre seems to be greater than the control Centre, so there is a higher mean for activities and the boxplot is more correct. The spread appears to be more than the spread for the Activities group for the Control group, since it has a higher standard deviation and the distance is greater between the boxplot whiskers. Both distributions tend to be left-skewed, since in the boxplot, the median (line in the box of the boxplot) tends to be more to the right.

(b)

To determine

To Explain: the finding that an improvement in the mean DRP score was prompted by new reading practises.

(b)

Expert Solution
Check Mark

Answer to Problem 51E

Yes

Explanation of Solution

Given:

  x¯1=51.4762x¯2=41.5217s1=11.0074s2=17.1487n1=21n2=23

Formula used:

  t=x¯1x¯2s12n1+s22n2

Calculation:

The test statistic:

  t=x¯1x¯2s12n1+s22n2=51.476241.521711.0074221+17.1487223=2.311

Degrees of freedom:

  df=min(n11,n21)=min(211,231)=20

The P-value is

  0.01<P<0.02

  P<0.05Reject H0

Enough evidence exists to support the statement that the mean DRP score for the children who took the reading activities is significantly greater.

(c)

To determine

To Explain: that it can be inferred that the latest reading practises have contributed to an improvement in the average DRP score, yes or no.

(c)

Expert Solution
Check Mark

Answer to Problem 51E

Yes

Explanation of Solution

Yes, since the data was obtained by using a randomised trial and a randomised trial can show causation.

(d)

To determine

To construct: and interpret the difference in mean DRP scores for a 95 percent confidence interval and clarify that this interval presents more details than part (b) of the significance test.

(d)

Expert Solution
Check Mark

Answer to Problem 51E

(0.9688, 18.9402)

Explanation of Solution

Given:

  x¯1=51.4762x¯2=41.5217s1=11.0074s2=17.1487n1=21n2=23

Formula used:

For the confidence interval

  (x¯1x¯2)±tα/2×s12n1+s22n2

Calculation:

Degrees of freedom is

  df=min(n11,n21)=min(211,231)=20

Finding the t with df=20 and c=95%

  t=tα/2=2.086

The confidence interval for μ1μ2 are:

  (x¯1x¯2)tα/2×s12n1+s22n2=(51.476241.5217)2.086×11.0074221+17.1487223=0.9688(x¯1x¯2)+tα/2×s12n1+s22n2=(51.476241.5217)+2.086×11.0074221+17.1487223=18.9402

There are 95% sufficient confidence that the mean difference is between 0.9688 and 18.9402.

Chapter 10 Solutions

The Practice of Statistics for AP - 4th Edition

Ch. 10.1 - Prob. 4ECh. 10.1 - Prob. 5ECh. 10.1 - Prob. 6ECh. 10.1 - Prob. 7ECh. 10.1 - Prob. 8ECh. 10.1 - Prob. 9ECh. 10.1 - Prob. 10ECh. 10.1 - Prob. 11ECh. 10.1 - Prob. 12ECh. 10.1 - Prob. 13ECh. 10.1 - Prob. 14ECh. 10.1 - Prob. 15ECh. 10.1 - Prob. 16ECh. 10.1 - Prob. 17ECh. 10.1 - Prob. 18ECh. 10.1 - Prob. 19ECh. 10.1 - Prob. 20ECh. 10.1 - Prob. 21ECh. 10.1 - Prob. 22ECh. 10.1 - Prob. 23ECh. 10.1 - Prob. 24ECh. 10.1 - Prob. 25ECh. 10.1 - Prob. 26ECh. 10.1 - Prob. 27ECh. 10.1 - Prob. 28ECh. 10.1 - Prob. 29ECh. 10.1 - Prob. 30ECh. 10.1 - Prob. 31ECh. 10.1 - Prob. 32ECh. 10.1 - Prob. 33ECh. 10.1 - Prob. 34ECh. 10.2 - Prob. 1.1CYUCh. 10.2 - Prob. 1.2CYUCh. 10.2 - Prob. 1.3CYUCh. 10.2 - Prob. 1.4CYUCh. 10.2 - Prob. 2.1CYUCh. 10.2 - Prob. 3.1CYUCh. 10.2 - Prob. 35ECh. 10.2 - Prob. 36ECh. 10.2 - Prob. 37ECh. 10.2 - Prob. 38ECh. 10.2 - Prob. 39ECh. 10.2 - Prob. 40ECh. 10.2 - Prob. 41ECh. 10.2 - Prob. 42ECh. 10.2 - Prob. 43ECh. 10.2 - Prob. 44ECh. 10.2 - Prob. 45ECh. 10.2 - Prob. 46ECh. 10.2 - Prob. 47ECh. 10.2 - Prob. 48ECh. 10.2 - Prob. 49ECh. 10.2 - Prob. 50ECh. 10.2 - Prob. 51ECh. 10.2 - Prob. 52ECh. 10.2 - Prob. 53ECh. 10.2 - Prob. 54ECh. 10.2 - Prob. 55ECh. 10.2 - Prob. 56ECh. 10.2 - Prob. 57ECh. 10.2 - Prob. 58ECh. 10.2 - Prob. 59ECh. 10.2 - Prob. 60ECh. 10.2 - Prob. 61ECh. 10.2 - Prob. 62ECh. 10.2 - Prob. 63ECh. 10.2 - Prob. 64ECh. 10.2 - Prob. 65ECh. 10.2 - Prob. 66ECh. 10.2 - Prob. 67ECh. 10.2 - Prob. 68ECh. 10.2 - Prob. 69ECh. 10.2 - Prob. 70ECh. 10.2 - Prob. 71ECh. 10.2 - Prob. 72ECh. 10.2 - Prob. 73ECh. 10.2 - Prob. 74ECh. 10.2 - Prob. 75ECh. 10.2 - Prob. 76ECh. 10 - Prob. 1CRECh. 10 - Prob. 2CRECh. 10 - Prob. 3CRECh. 10 - Prob. 4CRECh. 10 - Prob. 5CRECh. 10 - Prob. 6CRECh. 10 - Prob. 7CRECh. 10 - Prob. 8CRECh. 10 - Prob. 9CRECh. 10 - Prob. 10CRECh. 10 - Prob. 1PTCh. 10 - Prob. 2PTCh. 10 - Prob. 3PTCh. 10 - Prob. 4PTCh. 10 - Prob. 5PTCh. 10 - Prob. 6PTCh. 10 - Prob. 7PTCh. 10 - Prob. 8PTCh. 10 - Prob. 9PTCh. 10 - Prob. 10PTCh. 10 - Prob. 11PTCh. 10 - Prob. 12PTCh. 10 - Prob. 13PTCh. 10 - Prob. 1PT3Ch. 10 - Prob. 2PT3Ch. 10 - Prob. 3PT3Ch. 10 - Prob. 4PT3Ch. 10 - Prob. 5PT3Ch. 10 - Prob. 6PT3Ch. 10 - Prob. 7PT3Ch. 10 - Prob. 8PT3Ch. 10 - Prob. 9PT3Ch. 10 - Prob. 10PT3Ch. 10 - Prob. 11PT3Ch. 10 - Prob. 12PT3Ch. 10 - Prob. 13PT3Ch. 10 - Prob. 14PT3Ch. 10 - Prob. 15PT3Ch. 10 - Prob. 16PT3Ch. 10 - Prob. 17PT3Ch. 10 - Prob. 18PT3Ch. 10 - Prob. 19PT3Ch. 10 - Prob. 20PT3Ch. 10 - Prob. 21PT3Ch. 10 - Prob. 22PT3Ch. 10 - Prob. 23PT3Ch. 10 - Prob. 24PT3Ch. 10 - Prob. 25PT3Ch. 10 - Prob. 26PT3Ch. 10 - Prob. 27PT3Ch. 10 - Prob. 28PT3Ch. 10 - Prob. 29PT3Ch. 10 - Prob. 30PT3Ch. 10 - Prob. 31PT3Ch. 10 - Prob. 32PT3Ch. 10 - Prob. 33PT3Ch. 10 - Prob. 34PT3Ch. 10 - Prob. 35PT3
Knowledge Booster
Background pattern image
Statistics
Learn more about
Need a deep-dive on the concept behind this application? Look no further. Learn more about this topic, statistics and related others by exploring similar questions and additional content below.
Recommended textbooks for you
Text book image
MATLAB: An Introduction with Applications
Statistics
ISBN:9781119256830
Author:Amos Gilat
Publisher:John Wiley & Sons Inc
Text book image
Probability and Statistics for Engineering and th...
Statistics
ISBN:9781305251809
Author:Jay L. Devore
Publisher:Cengage Learning
Text book image
Statistics for The Behavioral Sciences (MindTap C...
Statistics
ISBN:9781305504912
Author:Frederick J Gravetter, Larry B. Wallnau
Publisher:Cengage Learning
Text book image
Elementary Statistics: Picturing the World (7th E...
Statistics
ISBN:9780134683416
Author:Ron Larson, Betsy Farber
Publisher:PEARSON
Text book image
The Basic Practice of Statistics
Statistics
ISBN:9781319042578
Author:David S. Moore, William I. Notz, Michael A. Fligner
Publisher:W. H. Freeman
Text book image
Introduction to the Practice of Statistics
Statistics
ISBN:9781319013387
Author:David S. Moore, George P. McCabe, Bruce A. Craig
Publisher:W. H. Freeman
Statistics 4.1 Point Estimators; Author: Dr. Jack L. Jackson II;https://www.youtube.com/watch?v=2MrI0J8XCEE;License: Standard YouTube License, CC-BY
Statistics 101: Point Estimators; Author: Brandon Foltz;https://www.youtube.com/watch?v=4v41z3HwLaM;License: Standard YouTube License, CC-BY
Central limit theorem; Author: 365 Data Science;https://www.youtube.com/watch?v=b5xQmk9veZ4;License: Standard YouTube License, CC-BY
Point Estimate Definition & Example; Author: Prof. Essa;https://www.youtube.com/watch?v=OTVwtvQmSn0;License: Standard Youtube License
Point Estimation; Author: Vamsidhar Ambatipudi;https://www.youtube.com/watch?v=flqhlM2bZWc;License: Standard Youtube License