
Concept explainers
Videos
a)
The equation of least squares regression line.
Given:The dot plot and Minitab output for least squares
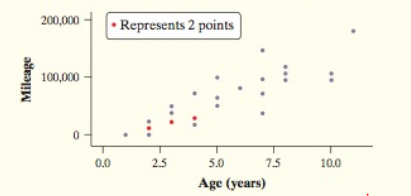
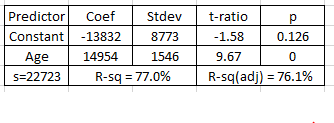
Explanation:The least regression analysis is carried out to explain mileage using age(in years) of cars. Here Age is explanatory variable(x) and mileage is response variable (y). The least square regression equation can be written using the coefficients of age which is slope and y intercept or coefficient of constant as shown below.
x is the age in years of the cars.
b)
Interpret the slope of the least square line.
Given:
The least square regression line equation is
Explanation:The least regression analysis is carried out to explain mileage using age(in years) of cars. Here Age is explanatory variable(x) and mileage is response variable (y). From the regression line the slope of the least squares regression line slope is the coefficient of explanatory variable or 14954 miles. The slope is interpreted as the amount by which response variable predicted to change for one unit change in explanatory variable. So, for an increment in age of the car the predicted mileage will increase by 14,954 miles.
c)
The residual for 10 year old car which has 110,000 miles on it.
Given:The least square regression line equation is
Calculation:The estimate of mileage for a 10 year old car is calculated as shown below
The residual is calculated as shown below
Conclusion:
The residual for the student’s 10 year old car is -25,708.
Chapter 10 Solutions
The Practice of Statistics for AP - 4th Edition
Additional Math Textbook Solutions
Elementary Statistics (13th Edition)
Elementary Statistics Using Excel (6th Edition)
Introductory Statistics (10th Edition)
Statistics for Psychology
Essentials of Statistics, Books a la Carte Edition (5th Edition)


 MATLAB: An Introduction with ApplicationsStatisticsISBN:9781119256830Author:Amos GilatPublisher:John Wiley & Sons Inc
 Probability and Statistics for Engineering and th...StatisticsISBN:9781305251809Author:Jay L. DevorePublisher:Cengage Learning
 Statistics for The Behavioral Sciences (MindTap C...StatisticsISBN:9781305504912Author:Frederick J Gravetter, Larry B. WallnauPublisher:Cengage Learning
 Elementary Statistics: Picturing the World (7th E...StatisticsISBN:9780134683416Author:Ron Larson, Betsy FarberPublisher:PEARSON
 The Basic Practice of StatisticsStatisticsISBN:9781319042578Author:David S. Moore, William I. Notz, Michael A. FlignerPublisher:W. H. Freeman
 Introduction to the Practice of StatisticsStatisticsISBN:9781319013387Author:David S. Moore, George P. McCabe, Bruce A. CraigPublisher:W. H. Freeman