
Concept explainers
Videos
The following table is similar to Table 11.2.It is used for making the preliminary computations for finding the least squares line for the given pairs of x- and y-values.
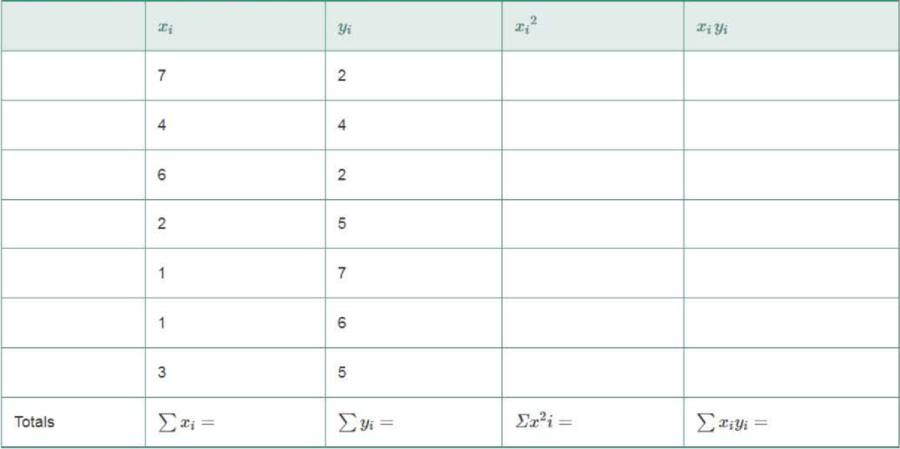
a. Complete the table.
b. Find SSxy.
c. Find SSxx·
d. Find
e. Find
f. Find
g. Find the least squares line.

Trending nowThis is a popular solution!

Chapter 11 Solutions
Statistics for Business and Economics (13th Edition)
Additional Math Textbook Solutions
Elementary Statistics Using the TI-83/84 Plus Calculator, Books a la Carte Edition (4th Edition)
Elementary Statistics: Picturing the World (7th Edition)
Introduction to Statistical Quality Control
EBK STATISTICAL TECHNIQUES IN BUSINESS
Statistics for Psychology
Elementary Statistics ( 3rd International Edition ) Isbn:9781260092561


- A chemical engineer discovered that by adding different amounts of an additive to gasoline, he could reduce the amount of nitrous oxides (NOx) from a car engine. A specified amount was added to one gallon of gasoline and the total amount of NOx in the exhaust was collected. Assume, in suitable units, that the data is: amount of additive 1 2 3 4 5 Nox 19 17 14 13 12 a) Obtain the least squares fit, of a straight line, for the amount of NOx b) Test whether or not the slope is β = 0. Consider a significance level of 0.01. c) Provide a 99% confidence interval for the mean value of NOx when the amount of additive is 9.arrow_forwardSelect the equation of the least squares line for the data: (51.00, 1.0), (48.75, 2.5), (52.50, .5), (46.50, 5.0), (45.00, 4.5), (41.25, 6.5), (43.50, 5.0). a) ŷ = -28.956 − 0.54067x b) ŷ = 28.956 − 0.59474x c) ŷ = 0.54067x − 28.956 d) ŷ = 31.852 − 0.59474x e) ŷ = 28.956 − 0.54067x f) None of the abovearrow_forwardThe following data is about the number of turns required to break a certain type of forged alloy bar, as well as the percentages of two alloying elements present in the metal. A) Fit a least squares regression plane and use its equation to estimate the number of turns required to break one of the bars, when x1 = 2.5 and x2 = 12 In the tabley = number of turnsx1 =% of element Ax2 =% of element Barrow_forward
- obtain the least squares fit for a linearrow_forwardAssume that the table below displays the number of freight tonnes carried (in millions) in Australia between 1990 and 2015.Year199019952000200520102015Number of freight tonnes (millions)6684104126160186a) Draw a scatter diagram of the data.b) Find the least squares regression line of number of freight tonnes (in millions) carried on a year. (Note: Use only the last two digits of the year).c) Draw the line in (b) on the scatter diagram in (a). Comment on whether you feel the line is a good fit of the data.d) Use the line in (b) to predict the number of freight tonnes that might be carried in Australia in both 2020 and 2025.e) Do you think your predictions in (d) will be relatively accurate? Why or why not?arrow_forwardEx[lain the Two Stage Least Squares Estimator?arrow_forward
- An owner of a home in the Midwest installed solar panels to reduce heating costs. After installing the solar panels, he measured the amount of natural gas used y (in cubic feet) to heat the home and outside temperature x (in degree-days, where a day's degree-days are the number of degrees its average temperature falls below 65° F) over a 23-month period. He then computed the least-squares regression line for predicting y from x and found it to be ŷ = 85 + 16x. The software used to compute the least-squares regression line for the equation above says that r2 = 0.98. This suggests which of the following? 1. Gas used increases by square root of 0.98 = 0.99 cubic feet for each additional degree-day? 2. Although degree-days and gas used are correlated, degree-days do not predict gas used very accurately. 3. Prediction of gas used from degree-days will be quite accurate.arrow_forwardA chemical company, seeking to study the effect of extraction time on the efficiency of an extraction operation, obtained the data from a table: Fit a straight line to the data given with the least squares method and use it to predict the extraction efficiency that would be expected when the extraction time is 35 minutes. x = Extraction time (minutes)y = Extraction efficiency (%)arrow_forwardFind the least squares approximating line for the given points and compute the corresponding least squares error. (0, 3), (1, 3), (2, 5)arrow_forward
 Linear Algebra: A Modern IntroductionAlgebraISBN:9781285463247Author:David PoolePublisher:Cengage Learning