
Concept explainers
Videos
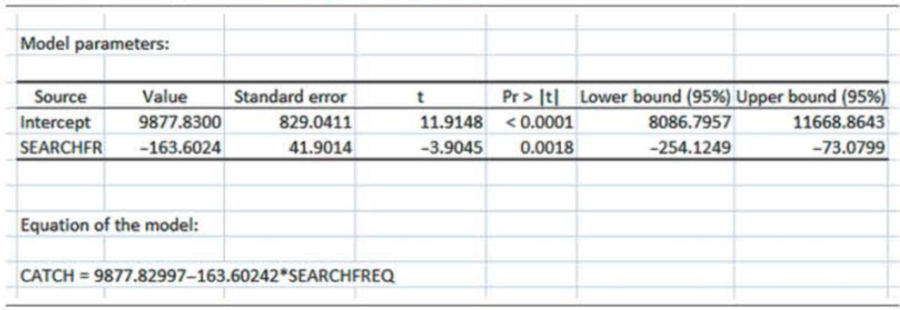
Lobster fishing study. Refer to the Bulletin of Marine Science (April 201 0) study of teams of fishermen fishing for the red spiny lobster in Baja California Sur, Mexico, Exercise 11. 20 (p. 630). A simple linear regression model relating y =total catch of lobsters (in kilograms) and x =average percentage of traps allocated per day to exploring areas of unknown catch (called search frequency) was fit to the data in the file. A portion of the XLSTAT printout is reproduced at the bottom of the page.
a. Give the null and alternative hypotheses for testing whether total catch (y) is negatively linearly related to search frequency (x).
b. Find the p-value of the test on the XLSTAT printout.
c. Give the appropriate conclusion of the test, part c, using α = .05.
XLSTAT output for Exercise 11.50
Want to see the full answer?
Check out a sample textbook solution
Chapter 11 Solutions
Statistics for Business and Economics (13th Edition)


- Olympic Pole Vault The graph in Figure 7 indicates that in recent years the winning Olympic men’s pole vault height has fallen below the value predicted by the regression line in Example 2. This might have occurred because when the pole vault was a new event there was much room for improvement in vaulters’ performances, whereas now even the best training can produce only incremental advances. Let’s see whether concentrating on more recent results gives a better predictor of future records. (a) Use the data in Table 2 (page 176) to complete the table of winning pole vault heights shown in the margin. (Note that we are using x=0 to correspond to the year 1972, where this restricted data set begins.) (b) Find the regression line for the data in part ‚(a). (c) Plot the data and the regression line on the same axes. Does the regression line seem to provide a good model for the data? (d) What does the regression line predict as the winning pole vault height for the 2012 Olympics? Compare this predicted value to the actual 2012 winning height of 5.97 m, as described on page 177. Has this new regression line provided a better prediction than the line in Example 2?arrow_forwardA mail-order business selling personal computer supplies, software and hardware maintains a centralized warehouse. Management is currently examining the process of distribution from the warehouse and wants to study the factors that affect the warehouse distribution costs. Data collected over 24 random months contain the warehouse’s distribution cost (in thousands of Rands), the sales (in thousands of Rands) and the number of orders received. A multiple linear regression model was fitted to the data by using Stat1.2. Use the output to answer the questions that follow by typing only the letter of the correct option in the answer boxes. Variablesy: Warehouse Distribution Costx1: Salesx2: Number of Orders Model Fitting StatisticsR2 = 0.8504Adj R2: ? Regression Coefficients Beta Parameter Standard b Parameter Standard Estimates…arrow_forwardIt is believed that the annual repair cost for the sporty automobile Jeep is related to its age. A sample of 11 automobiles revealed the results in the table at the right. Car age (xi) 2 3 1 7 5 8 1 2 6 9 4 Repair cost (yi) in £ 72 99 65 138 67 140 83 101 170 121 114 Define the terms regression and correlation analysis From the simple linear model , determine parameters and , with an interpretation of your linear model What would be the cost of repairing car that has been in use for 13 yearsarrow_forward
- The owner of Showtime Movie Theaters, Inc., would like to predict weekly gross revenueas a function of advertising expenditures. Historical data for a sample of eight weeks follow. Weekly GrossRevenue($1000s) Television Advertising($1000s) Newspaper Advertising($1000s) 96 5.0 1.5 90 2.0 2.0 95 4.0 1.5 92 2.5 2.5 95 3.0 3.3 94 3.5 2.3 94 2.5 4.2 94 3.0 2.5 a. Develop an estimated regression equation with the amount of televisionadvertising as the independent variable.b. Develop an estimated regression equation with both television advertising and newspaper advertising as the independent variables. c. Is the estimated regression equation coefficient for television advertisingexpenditures the same in part (a) and in part (b)? Interpret the coefficient in each case. d. Predict weekly gross revenue for a week when $3500 is spent on television advertising and $1800 is spent on newspaper advertising.arrow_forwardA researcher notes that, in a certain region, a disproportionate number of software millionaires were born around the year 1955. Is this a coincidence, or does birth year matter when gauging whether a software founder will besuccessful? The researcher investigated this question by analyzing the data shown in the accompanying table. Complete parts a through c below. a. Find the coefficient of determination for the simple linear regression model relating number (y) of software millionaire birthdays in a decade to total number (x) of births in the region. Interpret the result. The coefficient of determination is 1.___? (Round to three decimal places as needed.) This value indicates that 2.____ of the sample variation in the number of software millionaire birthdays is explained by the linear relationship with the total number of births in the region. (Round to one decimal place as needed.) b. Find the coefficient of determination for the simple linear regression model…arrow_forwardThe following table gives information on the amount of sugar (in grams) and the calorie count in one serving of a sample of varieties of Kellogg's cereal. Find the predictive regression equation of the number of calories on the amount of sugar. Sugar (grams) 6 15 12 11 8 6 7 4 9 14 20 13 3 Calories 120 200 150 110 120 80 190 120 120 190 190 120 120arrow_forward
- The owner of Showtime Movie Theaters, Inc. would like to predict weekly gross revenue as a function of advertising expenditures. Historical data for a sample of eight weeks follow. Weekly GrossRevenue($1000s) TelevisonAdvertising($1000s) NewspaperAdvertising($1000s) 96 5.0 1.5 90 2.0 2.0 95 4.0 1.5 92 2.5 2.5 95 3.0 3.3 94 3.5 2.3 94 2.5 4.2 94 3.0 2.5 Part A: Develop an estimated regression equation with the amount of television advertising as the independent variable. Part B: Develop an estimated regression equation with both television advertising and news paper advertising as independent variables. Part C: Is the estimated regression rquation coefficient for television advertising expenditures the same in part (a) and in part (b) ? Interpret the coefficient in each case. Part D : Predict Weekly gross revenue for a week $3500 is spent on television advertising and $1800 is spent on newspaper advertising? Please hurryarrow_forwardA sixth-grade teacher believes that there is a relationship between his students’ IQscores (y) and the numbers of hours (x) they spend watching television each week. Thefollowing table shows a random sample of 7 sixth-grade students.y 125 116 97 114 85 107 105x 5 10 30 16 41 28 21 Does the data provide sufficient evidence to indicate that the simple linear regressionmodel is appropriate to describe the relationship between x and y? Perform a model utilitytest at α = 0.05. (Give H0, Ha, rejection region, observed test statistic, P-value, decisionand conclusion.)Find the Pearson sample correlation coefficient between x and y. Then interpretthe result.arrow_forwardAn auto manufacturing company wanted to investigate how the price of one of its car models depreciates with age. The research department at the company took a sample of eight cars of this model and collected the following information on the ages (in years) and prices (in hundreds of dollars) of these cars. Age 8 8 5 2 6 5 2 2 Price 38 19 53 70 40 51 80 80 1.) Find the least squares regression line equation in the form ^ = a+bx. y Use "Age" as the independent variable and "Price" as the dependent variable. 2.) Predict the price of a 5 year old car of this model. ypred=arrow_forward
- It is believed that the annual repair cost for the sporty automobile Jeep is related to its age. A sample of 11 automobiles revealed the results in the table at the right. Car age (xi) 2 3 1 7 5 8 1 2 6 9 4 Repair cost (yi) in £ 72 99 65 138 67 140 83 101 170 121 114 Define the terms regression and correlation analysis . From the simple linear model ,y= a + bx ,determine parameters a and barrow_forwardLife insurance companies are keenly interested in predicting how long their customers are likely to live, because this will determine their premiums and ultimately their profitability. An Australian life insurance company is interested in the relationship, if any, between the age at death of their male customers and that of the customer’s father. Data are collected on a random sample of 100 of their male customers who have recently died. The customer’s age at death was plotted against that of their father and a linear regression model applied. Relevant output is shown below. Say how you know from the output that there actually is a significant linear relationship between a male customer’s age at death and his father’s age at death. State the value of the coefficient of Father’s Age (Death) and interpret this value in the context of the problem at hand.State the value of the coefficient of determination in the model and interpret this value in the context of the situation.arrow_forwardLife insurance companies are keenly interested in predicting how long their customers are likely to live, because this will determine their premiums and ultimately their profitability. An Australian life insurance company is interested in the relationship, if any, between the age at death of their male customers and that of the customer’s father. Data are collected on a random sample of 100 of their male customers who have recently died. The customer’s age at death was plotted against that of their father and a linear regression model applied. Relevant output is shown below Examine both the scatterplot and the correlation matrix provided above. Comment on the apparent relationship between the customer’s age at death and their father’s age at death in the plot. Explain how the information in the correlation matrix supports your conclusionarrow_forward
 College AlgebraAlgebraISBN:9781305115545Author:James Stewart, Lothar Redlin, Saleem WatsonPublisher:Cengage Learning
 Linear Algebra: A Modern IntroductionAlgebraISBN:9781285463247Author:David PoolePublisher:Cengage Learning