
Concept explainers
Videos
For Exercises 7 through 31, perform the following steps.
a. State the hypotheses and identify the claim.
b. Find the critical value.
c. Compute the test value.
d. Make the decision.
e. Summarize the results.
23. Youth Physical Fitness According to a recent survey, 64% of Americans between the ages of 6 and 17 years cannot pass a basic fitness test. A physical education instructor wishes to determine if the percentages of such students in different schools in his school district are the same. He administers a basic fitness test to 120 randomly selected students in each of four schools. The results are shown here. At α = 0.05, test the claim that the proportions who pass the test are equal.
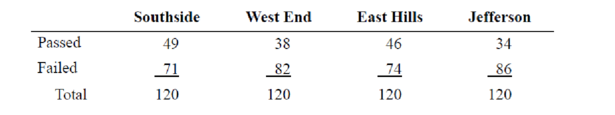
Source: The Harper’s Index Book.
Want to see the full answer?
Check out a sample textbook solution
Chapter 11 Solutions
Elementary Statistics: A Step By Step Approach


- Which pair of the hypotheses would be correct for the following claim: Claim: The percentage of cars sold with manual transmission is 2018 (group 1) is lower than the percentage of cars sold with manual transmission in 2010 (group 2) A. H0 :p1 −p2 =0andH1 :p1 −p2 <0 B. H0 :p1 −p2 <0andH1 :p1 −p2 =0 C. H0 :p1 −p2 =0andH1 :p1 −p2 ̸=0 D. H0 :p1 −p2 ̸=0andH1 :p1 −p2 =0 E. H0 :p1 −p2 =0andH1 :p1 −p2 >0 F. H0 :p1 −p2 >0andH1 :p1 −p2 =0arrow_forward3. J.D. Power and Associates conducts vehicle quality surveys to provide automobile manufacturers with consumersatisfaction information about their products (Vehicle Quality Survey, January 2010). Using a sample of vehicleowners from recent vehicle purchase records, the survey asks the owners a variety of questions about their newvehicles, such as those shown below. For each question, state whether the data collected are categorical orquantitative and indicate the measurement scale being used.a. Did you purchase or lease the vehicle?b. What price did you pay for the vehicle?c. How likely would you be to recommend this vehicle to a friend? (Definitely Not, Probably Not, Probably Will,and Definitely Will)d. What is your overall rating of your new vehicle (Unacceptable, Average, Outstanding, or Truly Exceptional)?arrow_forwardThe director of student services at San Bernardino Valley College is interested in whether women are just as likely to attend orientation as men before they begin their coursework. A random sample of freshmen at San Bernardino Valley College were asked to specify their gender and whether they attended the orientation. The results of the survey are shown below: Data for Gender vs. Orientation Attendance Women Men Yes 422 529 No 267 268 Let p1 be the proportion of women who attended the orientation and p2p2 be the proportion of men who attended the orientation. What can be concluded at the α = 0.10 level of significance? For this study, what sampling distribution should be used? Select an answer Chi-Square distribution uniform distribution standard normal distribution binomial distribution Student t distribution The null and alternative hypotheses would be: H0:H0: Select an answer μ μ1-μ2 p1-p2 μd p Select an answer ≠ < > = (please enter a decimal)…arrow_forward
- Use the answers provided to answer. Include a written summary of your interpretation of the results. In addition, provide your recommendation to the state legislature with a brief explanation as to why you feel it is the best option for implementing public health policy for screening among the target population.arrow_forwardAnswer the following using the Boxplot attached. 1a) Which region (North or South) has the town with the largest mortality?b) Which region (North or South) has the town with the smallest mortality?c) In terms of the central tendency, which region has a higher mortality?d) Is the mortality more dispersed in the North or the South?arrow_forwardThe director of student services at San Bernardino Valley College is interested in whether women are more likely to attend orientation than men before they begin their coursework. A random sample of freshmen at San Bernardino Valley College were asked to specify their gender and whether they attended the orientation. The results of the survey are shown below: Data for Gender vs. Orientation Attendance Women Men Yes 399 361 No 260 264 Let p1 be the proportion of women who attended the orientation and p2p2 be the proportion of men who attended the orientation. What can be concluded at the αα = 0.01 level of significance? The null and alternative hypotheses would be: H0:H0: Select an answer μ1-μ2 μd μ p1-p2 p Select an answer ≠ < > = (please enter a decimal) H1:H1: Select an answer μ1-μ2 p1-p2 μ μd p Select an answer ≠ = > < (Please enter a decimal) The test statistic? t z = (please show your answer to 3 decimal places.) The p-value =…arrow_forward
- For the following hypotheses, identify the independent and dependent variables. States with more restrictions on obtaining abortions will have lower abortion rates. Counties paying teachers more will have higher standardized test scores. The lower a state’s per capita income, the less money spent per resident on road maintenance.arrow_forwardThe director of student services at San Bernardino Valley College is interested in whether women are more likely to attend orientation than men before they begin their coursework. A random sample of freshmen at San Bernardino Valley College were asked to specify their gender and whether they attended the orientation. The results of the survey are shown below: Data for Gender vs. Orientation Attendance Women Men Yes 375 336 No 316 329 Let p1p1 be the proportion of women who attended the orientation and p2p2 be the proportion of men who attended the orientation. What can be concluded at the αα = 0.10 level of significance? What is the test statistic and p valuearrow_forward3. As part of the National Health and Nutrition Examination Survey, the Department of Health andHuman Services obtained self-reported heights and measured the heights for males aged 12-16. Allmeasurements are in inches. Is there a difference between the reported height vs. the measured height?Use a 0.05 level of significance.ReportedHeight68 71 63 71 71 60 65 64 54 63 66 72MeasuredHeight67.9 69.9 64.9 68.3 70.3 60.6 64.5 67.0 55.6 74.2 65.0 70.8DifferenceNull and alternative hypothesis (give both in symbolic form and sentence form):Test statistic and p-value (show the calculation or show what you entered into the calculator (screenshotsare ok here)):Technical conclusion, circle one: reject the null hypothesis or fail to reject the null hypothesisWhy did you choose to reject or fail to reject the null hypothesis?Nontechnical conclusion addressing the original claim:arrow_forward
 Glencoe Algebra 1, Student Edition, 9780079039897...AlgebraISBN:9780079039897Author:CarterPublisher:McGraw Hill