
Concept explainers
Videos
For Exercises 5 through 18, perform these steps.
a. State the hypotheses and identify the claim.
b. Find the critical value.
c. Compute the test value.
d. Make the decision.
e. Summarize the results.
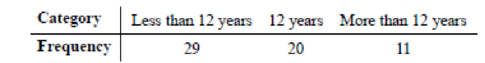
18. Education Level and Health Insurance A researcher wishes to see if the number of randomly selected adults who do not have health insurance is equally distributed among three categories (less than 12 years of education, 12 years of education, more than 12 years of education). A sample of 60 adults who do not have health insurance is selected, and the results are shown. At α = 0.05, can it be concluded that the frequencies are not equal? Use the P-value method. If the null hypothesis is rejected, give a possible reason for this.
Source: U.S. Census Bureau.
Want to see the full answer?
Check out a sample textbook solution
Chapter 11 Solutions
Elementary Statistics: A Step By Step Approach


- Maria has two routes, E and W, she can take when commuting to work. Both routes go through a railroad crossing, and sometimes she needs to stop at the crossing to allow trains to pass. She claims that the proportion of times she needs to stop when taking route E is different from the proportion of times she needs to stop when taking route W. She conducted the following hypothesis test at the significance level of α=0.10. H0:pE=pWHa:pE≠pW In the hypotheses, pE represents the proportion of times she needs to stop at the crossing when using route E, and pWrepresents the proportion of times she needs to stop at the crossing when using route W. All conditions for inference were met, and the resulting p-value was 0.37. Which of the following is the correct decision for the test? The p-value is less than α, and the null hypothesis is rejected. There is convincing evidence to support the claim that the proportion of times she needs to stop at the crossing is different for the…arrow_forwardState the null and alternative hypotheses to be used in testing the following claims also explain type of test.(a) At most, 20% of next year’s wheat crop will be exported to the Soviet Union.(b) On the average, American homemakers drink 3 cups of coffee per day.(c) The proportion of college graduates in Virginia this year who majored in the social sciences is at least 0.15.(d) The average donation to the American Lung Association is no more than $10.(e) Residents in suburban Richmond commute, on the average, 15 kilometers to their place of employmentarrow_forwardFollow the steps in testing hypothesis to answer the problem:arrow_forward
- Brown wants to conduct an assessment of where employees live and how employees work. Brown wanted to know if where you lived was related to how you worked. What hypothesis tests can be used in this case?arrow_forwardOf the claims shown below, determine which are valid statistical hypotheses and which are not. For those claims that are not valid, explain why. (a) p = 0.6 (b) x > 42 (c) µ < 87 1 (d) σ 2 6= 36 (e) pˆ1 = ˆp2 (f) µ1 6= µ2 (g) x < y (h) σ 2 1 σ 2 2 > 4arrow_forwardGiven that the P-value for the hypothesis test is 0.501, what do you conclude? Does it appear that the heights were obtained through measurement or that the subjects reported their heights?arrow_forward
- Answer the following using the Boxplot attached. 1a) Which region (North or South) has the town with the largest mortality?b) Which region (North or South) has the town with the smallest mortality?c) In terms of the central tendency, which region has a higher mortality?d) Is the mortality more dispersed in the North or the South?arrow_forwardYou are working for the South Tahoe Tourist Bureau and are interested in determining if there is a relationship between the casino people frequent and the type of gambling that they do at the casino Table Games Slots Sports Harrah’s 50 60 12 Hard Rock 18 22 6 MontBleu 33 29 20 Harvey’s 41 39 20 a. State the null and alternative hypotheses. b. State which hypothesis test should be used. Calculate the p-Value and state the command you entered in the calculator. c. State the conclusion in the context of the problem.arrow_forward
 MATLAB: An Introduction with ApplicationsStatisticsISBN:9781119256830Author:Amos GilatPublisher:John Wiley & Sons Inc
 Probability and Statistics for Engineering and th...StatisticsISBN:9781305251809Author:Jay L. DevorePublisher:Cengage Learning
 Statistics for The Behavioral Sciences (MindTap C...StatisticsISBN:9781305504912Author:Frederick J Gravetter, Larry B. WallnauPublisher:Cengage Learning
 Elementary Statistics: Picturing the World (7th E...StatisticsISBN:9780134683416Author:Ron Larson, Betsy FarberPublisher:PEARSON
 The Basic Practice of StatisticsStatisticsISBN:9781319042578Author:David S. Moore, William I. Notz, Michael A. FlignerPublisher:W. H. Freeman
 Introduction to the Practice of StatisticsStatisticsISBN:9781319013387Author:David S. Moore, George P. McCabe, Bruce A. CraigPublisher:W. H. Freeman