
(a)
To State: The hypothesis and the claim.
(a)
Answer to Problem 10E
The null and alternative hypotheses are:
The claim of the test is that at least one of the proportions differs from its original value.
Explanation of Solution
Given info:
The data shows the percentages of most popular colors for light trucks. The level of significance is
Justification:
The survey wants to see that whether the proportions differ from the results of the survey or not. The null and alternative hypothesis can be defined as:
Null hypothesis:
Alternative hypothesis:
The claim of the test is that at least one of the proportions differs from its original value.
(b)
The critical value.
(b)
Answer to Problem 10E
The required critical value is 12.592.
Explanation of Solution
Degrees of freedom
The number of colors is 7.
The degrees of freedom, is calculated as:
Critical value:
The level of significance is
Therefore, the critical value is obtained from Table G: Chi-Square Distribution.
Procedure:
- Locate 6 in the column of degrees of freedom in the Table 6.
- Take the value corresponding to
From the table, the critical value is 12.592.
Thus, the critical value using
(c)
The value of the test statistic.
(c)
Answer to Problem 10E
The test statistic value is 10.9144.
Explanation of Solution
Calculation:
The expected frequency can be obtained as follows:
Where
The following table gives the observed and expected frequency:
| Frequency | White | Black | Red | Silver | Gray | Blue | Other |
| Observed | 45 | 32 | 30 | 30 | 22 | 15 | 6 |
| Expected | 54 | 30.6 | 25.2 | 21.6 | 19.8 | 14.4 | 14.4 |
Software procedure:
Step-by-step procedure to obtain the test statistic using the MINITAB software:
- Choose Stat> Tables> Chi-Square Goodness-of-Fit Test (one variable).
- Specify the “Observed count” as Observed and category names as Frequency.
- Under Test, select “Proportions specified by historical counts” as Expected.
- Click on OK.
Output using the MINITAB software is given below:
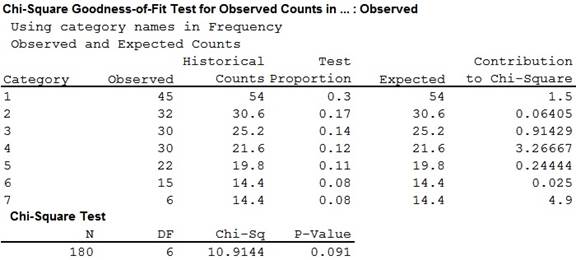
Therefore, the value of the test statistic is 10.9144.
(d)
To make: The decision.
(d)
Answer to Problem 10E
The null hypothesis will not be rejected.
Explanation of Solution
The test statistic is 10.9144.and the critical value is 12.592.
The chi-square statistic is less than the critical value.
That is,
Hence, it can be said that there is not enough evidence to reject the null hypothesis.
(e)
To summarize: The results.
(e)
Answer to Problem 10E
According to the obtained result, the claim is not true.
Explanation of Solution
The test statistic is 10.9144.and the critical value is 12.592.
The chi-square statistic is less than the critical value.
That is,
Thus, it can be said that there is not enough evidence to reject the null hypothesis.
Hence, the distribution is the same as stated in the null hypothesis.
That is, the claim is not true.
Want to see more full solutions like this?
Chapter 11 Solutions
Elementary Statistics: A Step By Step Approach

 MATLAB: An Introduction with ApplicationsStatisticsISBN:9781119256830Author:Amos GilatPublisher:John Wiley & Sons Inc
 Probability and Statistics for Engineering and th...StatisticsISBN:9781305251809Author:Jay L. DevorePublisher:Cengage Learning
 Statistics for The Behavioral Sciences (MindTap C...StatisticsISBN:9781305504912Author:Frederick J Gravetter, Larry B. WallnauPublisher:Cengage Learning
 Elementary Statistics: Picturing the World (7th E...StatisticsISBN:9780134683416Author:Ron Larson, Betsy FarberPublisher:PEARSON
 The Basic Practice of StatisticsStatisticsISBN:9781319042578Author:David S. Moore, William I. Notz, Michael A. FlignerPublisher:W. H. Freeman
 Introduction to the Practice of StatisticsStatisticsISBN:9781319013387Author:David S. Moore, George P. McCabe, Bruce A. CraigPublisher:W. H. Freeman