
Concept explainers
Videos
For Exercises 7 through 31, perform the following steps.
a. State the hypotheses and identify the claim.
b. Find the critical value.
c. Compute the test value.
d. Make the decision.
e. Summarize the results.
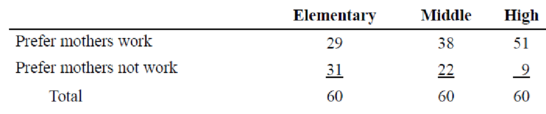
26. Mothers Working Outside the Home According to a recent survey, 59% of Americans aged 8 to 17 years would prefer that their mothers work outside the home.
regardless of what they do now. A school district psychologist decided to select three random samples of 60 students each in elementary, middle, and high school to see how the students in her district felt about the issue. At α = 0.10, test the claim that the proportions of the students who prefer that their mothers have jobs outside the home are equal.
Source: Daniel Weiss, 100% American.
Want to see the full answer?
Check out a sample textbook solution
Chapter 11 Solutions
Elementary Statistics: A Step By Step Approach


- A dental assistant is interested in the proportion of patients that need a root canal. Let the proportion of patients that need a root canal be p. If the dental assistant wanted to know if the proportion of patients that need a root canal is more than 20%, what are the null and alternative hypotheses? Select the correct answer below: H0: p=0.20; Ha: p<0.20 H0: p>0.20; Ha: p=0.20 H0: p=0.20; Ha: p>0.20 H0: μ=0.20; Ha: μ>0.20arrow_forwardBrown wants to conduct an assessment of where employees live and how employees work. Brown wanted to know if where you lived was related to how you worked. What hypothesis tests can be used in this case?arrow_forwardGiven the situation below, create a problem and determine (a) the null and alternative hypotheses, (b) test statistic, (c) rejection region, and (d) applicability of the CLT.arrow_forward
- Of the claims shown below, determine which are valid statistical hypotheses and which are not. For those claims that are not valid, explain why. (a) p = 0.6 (b) x > 42 (c) µ < 87 1 (d) σ 2 6= 36 (e) pˆ1 = ˆp2 (f) µ1 6= µ2 (g) x < y (h) σ 2 1 σ 2 2 > 4arrow_forwardYou are given the following hypotheses H 0 :p=0.3 H A :p not equal 0.3 We know that the sample size 90. For what sample proportion would the pvalue be equal to 0.1? Assume that all conditions necessary for Inference are satisfied.arrow_forwardBuyers are skeptical of an ATV advertisement that claims the newest model 4-wheeler gets an average of 17 miles per gallon. They believe the dealer is understating the average. Which null and alternative hypotheses should the buyer's test? Let µ represent the true average gas mileage. Group of answer choices H0: µ > 17 miles per gallon, Ha: µ ≥ 17 miles per gallon H0: µ ≤ 17 miles per gallon, Ha: µ < 17 miles per gallon H0: µ = 17 miles per gallon, Ha: µ > 17 miles per gallon H0: µ = 17 miles per gallon, Ha: µ < 17 miles per gallon H0: µ = 17 miles per gallon, Ha: µ ≠ 17 miles per gallonarrow_forward
- If the proportion of the population in City A that is over 65 years old is p1 and the proportion of the population in City B that is over 65 years old is p2, what is the null hypothesis for a test to determine if the proportion of the population that is over 65 years old is greater in City A? Select the correct answer below: H0: p1−p2=0 H0: p1−p2>0 H0: p1−p2<0 H0: p1−p2≠0arrow_forwardYou are given the following hypotheses: H0: p = 0.3HA: p ≠ 0.3 We know that the sample size is 90. For what sample proportion would the p-value be equal to 0.1? Assume that all conditions necessary for inference are satisfied.arrow_forwardThe average life expectancy of tires produced by the Whitney Tire Company has been 40,000 miles. Management believes that due to a new production process, the life expectancy of its tires has increased. In order to test the validity of this belief, the correct set of hypotheses is a. H 0: μ ≥ 40,000 H a: μ < 40,000 b. H 0: μ ≤ 40,000 H a: μ > 40,000 c. H 0: μ < 40,000 H a: μ ≥ 40,000 d. H 0: μ > 40,000 H a: μ ≤ 40,000arrow_forward
- Based on the data and Anova table, complete the parts of hypothesis testing Ho: ? Ha: ? Alpha: 0.05 F: 6.31 Condition: When to reject Ho? Conclusion?arrow_forwardMaria has two routes, E and W, she can take when commuting to work. Both routes go through a railroad crossing, and sometimes she needs to stop at the crossing to allow trains to pass. She claims that the proportion of times she needs to stop when taking route E is different from the proportion of times she needs to stop when taking route W. She conducted the following hypothesis test at the significance level of α=0.10. H0:pE=pWHa:pE≠pW In the hypotheses, pE represents the proportion of times she needs to stop at the crossing when using route E, and pWrepresents the proportion of times she needs to stop at the crossing when using route W. All conditions for inference were met, and the resulting p-value was 0.37. Which of the following is the correct decision for the test? The p-value is less than α, and the null hypothesis is rejected. There is convincing evidence to support the claim that the proportion of times she needs to stop at the crossing is different for the…arrow_forwardWhich pair of the hypotheses would be correct for the following claim: Claim: The percentage of cars sold with manual transmission is 2018 (group 1) is lower than the percentage of cars sold with manual transmission in 2010 (group 2) A. H0 :p1 −p2 =0andH1 :p1 −p2 <0 B. H0 :p1 −p2 <0andH1 :p1 −p2 =0 C. H0 :p1 −p2 =0andH1 :p1 −p2 ̸=0 D. H0 :p1 −p2 ̸=0andH1 :p1 −p2 =0 E. H0 :p1 −p2 =0andH1 :p1 −p2 >0 F. H0 :p1 −p2 >0andH1 :p1 −p2 =0arrow_forward
 MATLAB: An Introduction with ApplicationsStatisticsISBN:9781119256830Author:Amos GilatPublisher:John Wiley & Sons Inc
 Probability and Statistics for Engineering and th...StatisticsISBN:9781305251809Author:Jay L. DevorePublisher:Cengage Learning
 Statistics for The Behavioral Sciences (MindTap C...StatisticsISBN:9781305504912Author:Frederick J Gravetter, Larry B. WallnauPublisher:Cengage Learning
 Elementary Statistics: Picturing the World (7th E...StatisticsISBN:9780134683416Author:Ron Larson, Betsy FarberPublisher:PEARSON
 The Basic Practice of StatisticsStatisticsISBN:9781319042578Author:David S. Moore, William I. Notz, Michael A. FlignerPublisher:W. H. Freeman
 Introduction to the Practice of StatisticsStatisticsISBN:9781319013387Author:David S. Moore, George P. McCabe, Bruce A. CraigPublisher:W. H. Freeman