
Videos
Laboratory experiments designed to measure LC50 (lethal concentration killing 50%of the test species) values for the effect of certain toxicants on fish are run by two different methods. One method has water continuously flowing through laboratory tanks, and the other method has static water conditions. For purposes of establishing criteria for toxicants, the Environmental Protection Agency (EPA) wants to adjust all results to the flow-through condition. Thus, a model is needed to relate the two types of observations. Observations on toxicants examined under both static and flow-through conditions yielded the data in the accompanying table (measurements in parts per million, ppm). Fit the model Y = β0 + β1x + ε.
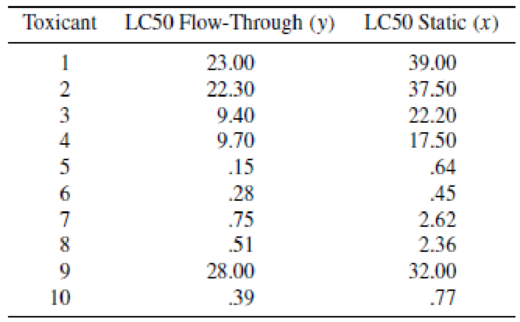
- a What interpretation can you give to the results?
- b Estimate the flow-through value for a toxicant with an LC50 static value of x = 12 ppm.

Trending nowThis is a popular solution!

Chapter 11 Solutions
Mathematical Statistics with Applications


- Cell Phone Radiation Listed below are the measured radiation absorption rates (in W/kg) corresponding to these cell phones: iPhone 5S, BlackBerry Z30, Sanyo Vero, Optimus V, Droid Razr, Nokia N97, Samsung Vibrant, Sony Z750a, Kyocera Kona, LG G2, and Virgin Mobile Supreme. The data are from the Federal Communications Commission. If one of each model of cell phone is measured for radiation and the results are used to find the measures of variation, are the results typical of the population of cell phones that are in use?arrow_forwardFoot ulcers are common problem for people with diabetes. Higher skin temperatures on the foot indicate an increased risk of ulcers. The article “An Intelligent Insole for Diabetic Patients with the Loss of Protective Sensation" (Kimberly Anderson, M.S. Thesis, Colorado School of Mines), reports measurements of temperatures, in °F, of both feet for 18 diabetic patients. The results are presented in the Table Q1. Table Ql: Measurements of temperatures, in °F of left foot Vs right foot for 18 diabetic patients Left Foot Right Foot Left Foot Right Foot 80 80 76 81 85 85 89 86 80 86 75 87 82 88 78 78 89 87 80 81 87 82 87 82 78 78 86 85 88 89 76 80 89 90 88 89 (d) Test the slope, ß1 = 1 at 5% level of significance. (e) Calculate the coefficient of correlation r and r2 and then interpret their valuesarrow_forwardAn experiment is conducted to see the effect of light intensity on plant growth, what is the dependent variable in this scenario?arrow_forward
- Please use the accompanying Excel data set or accompanying Text file data set when completing the following exercise. An article in Urban Ecosystems, "Urbanization and Warming of Phoenix (Arizona, USA): Impacts, Feedbacks and Mitigation" (2002, Vol. 6, pp. 183-203), mentions that Phoenix is ideal to study the effects of an urban heat island because it has grown from a population of 300,000 to approximately 3 million over the last 50 years and this is a period with a continuous, detailed climate record. The 50-year averages of the mean annual temperatures at eight sites in Phoenix are shown below. Check the assumption of normality in the population with a probability plot. Construct a 95% confidence interval for the standard deviation over the sites of the mean annual temperatures. Site Sky Harbor Airport 23.3 Phoenix Greenway 21.7 Phoenix Encanto 21.6 Waddell Litchfield Laveen Average Mean Temperature (°C) Maricopa Harlquahala i 21.7 21.3 20.7 20.9 20.1 Round the answers to three…arrow_forwardThe authors of a paper compared two different instruments for measuring a person's capacity for breathing out air. (This measurement is helpful in diagnosing various lung disorders.) The two instruments considered were a Wright peak flow meter and a mini-Wright peak flow meter. Seventeen people participated in the study, and for each person air flow was measured once using the Wright meter and once using the mini-Wright meter. The Wright meter is thought to provide a better measure of air flow, but the mini-Wright meter is easier to transport and to use. Use of the mini-Wright meter could be recommended as long as there is not convincing evidence that the mean reading for the mini-Wright meter is different from the mean reading for Wright meter. For purposes of this exercise, you can assume that it is reasonable to consider the 17 people who participated in this study as representative of the population of interest. Data values from this paper are given in the accompanying table.…arrow_forwardThe authors of a paper compared two different instruments for measuring a person's capacity for breathing out air. (This measurement is helpful in diagnosing various lung disorders.) The two instruments considered were a Wright peak flow meter and a mini-Wright peak flow meter. Seventeen people participated in the study, and for each person air flow was measured once using the Wright meter and once using the mini-Wright meter. The Wright meter is thought to provide a better measure of air flow, but the mini-Wright meter is easier to transport and to use. Use of the mini-Wright meter could be recommended as long as there is not convincing evidence that the mean reading for the mini-Wright meter is different from the mean reading for Wright meter. For purposes of this exercise, you can assume that it is reasonable to consider the 17 people who participated in this study as representative of the population of interest. Data values from this paper are given in the accompanying table.…arrow_forward
- Please use the accompanying Excel data set or accompanying Text file data set when completing the following exercise. An article in Urban Ecosystems, "Urbanization and Warming of Phoenix (Arizona, USA): Impacts, Feedbacks and Mitigation" (2002, Vol. 6, pp. 183–203), mentions that Phoenix is ideal to study the effects of an urban heat island because it has grown from a population of 300,000 to approximately 3 million over the last 50 years and this is a period with a continuous, detailed climate record. The 50-year averages of the mean annual temperatures at eight sites in Phoenix are shown below. Check the assumption of normality in the population with a probability plot. Construct a 95% confidence interval for the standard deviation over the sites of the mean annual temperatures. Site Sky Harbor Airport 23.3 Average Mean Temperature (°C) Phoenix Greenway 21.7 Phoenix Encanto Waddell 21.6 21.7arrow_forwardCell Phone Radiation Listed below are the measured radiation absorption rates (in W/kg) corresponding to these cell phones: iPhone 5S, BlackBerry Z30, Sanyo Vero, Optimus V, Droid Razr, Nokia N97, Samsung Vibrant, Sony Z750a, Kyocera Kona, LG G2, and Virgin Mobile Supreme. The data are from the Federal Communications Commission (FCC). The media often report about the dangers of cell phone radiation as a cause of cancer. The FCC has a standard that a cell phone absorption rate must be 1.6 W/kg or less. If you are planning to purchase a cell phone, are any of the measures of center the most important statistic? Is there another statistic that is most relevant? If so, which one?arrow_forwardI am determining how effective a Drug is at reducing inflammation in individuals infected with a virus. the serum levels of antibody are measured as a measure of inflammation (less antibodies means less inflammation which decreases virus mortality) in 30 people given placebo, 30 people given 1 unit of the drug, and 30 people given 2 units of the drug. I would like to determine what levels of the drug are effective, and if there are sex-specific effects. What are the dependent and independent variables in this experiment? age _________ sex __________ antibody level _____________ treatment ___________arrow_forward
- Please use the accompanying Excel data set or accompanying Text file data set when completing the following exercise. An article in Journal of Food Science (2001, Vol. 66, No. 3, pp. 472-477) studied potato spoilage based on different conditions of acidified oxine (AO), which is a mixture of chlorite and chlorine dioxide. The data are shown below: AO Solution (ppm) % Spoilage 50 100 50 60 100 60 30 30 200 60 50 29 400 25 30 15 (a) Do the AO solutions differ in the spoilage percentage? Use a = 0.05. There is for significant differences in the spoilage percentage when using different AO solutions. (b) Find the P-value of the test. Estimate the variability due to random error. P-value = i (Round your answer to three decimal places.) MSE = i . (Round your answer to the nearest integer.) (c) Plot average spoilage against AO solution and interpret the results. Which AO solution would you recommend for use in practice? AO solution will be used. (d) Analyze the residual plots to determine…arrow_forwardDDT (dichlorodiphenyltrichloroethane) was used extensively from 1940 to 1970 as an insecticide. It still sees limited use for control of disease. But DDT was found to be harmful to plants and animals, including humans, and its effects were found to be lasting. The amount of time that DDT remains in the environment depends on many factors, but the following table shows what can be expected of 200 kilograms of DDT that has seeped into the soil. t = time in yearssince application D = DDT remaining,kilograms 0 200.00 1 190.00 2 180.50 3 171.48 (a) Show that the data are exponential. The ratio from year 0 to year 1 is ______ , from year 1 to year 2 is ____ , and from year 2 to year 3 is_____ (rounded to two decimal places). Because these successive ratios are all , a) different b)the same , the data are exponential.arrow_forwardA researcher is investigating the effectiveness of two weight loss treatments. The number of patients attending Treatment A and Treatment B are 30 and 32 respectively. The patients’ weight losses (in Kg) after a two-month treatment period are recorded and shown in Table 1: What type of research design you think this research should be classified? Explain your answer. Based on the research objective of the study, identify the: Independent and dependent variables of this research. Scale of measurement of each of the independent and dependent variables. For EACH of the treatment, determine/construct the following measures and histograms of weight losses using SPSS or any suitable statistical analysis tool: Mean Median Range Histogram d. Based on the histograms of weight losses produced in (c), briefly describe: The shape of distribution of weight losses for EACH treatment. How does the distribution of Treatment A differ from Treatment B e.…arrow_forward
 Linear Algebra: A Modern IntroductionAlgebraISBN:9781285463247Author:David PoolePublisher:Cengage Learning
 Big Ideas Math A Bridge To Success Algebra 1: Stu...AlgebraISBN:9781680331141Author:HOUGHTON MIFFLIN HARCOURTPublisher:Houghton Mifflin Harcourt