
Concept explainers
Videos
Applet Exercise Refer to Exercises 11.2 and 11.5. The data from Exercise 11.5 appear in the graph under the heading “Another Example” in the applet Fitting a Line Using Least Squares. Again, the horizontal blue line that initially appears on the graph is a line with 0 slope.
- a What is the intercept of the line with 0 slope? What is the value of SSE for the line with 0 slope?
- b Do you think that a line with negative slope will fit the data well? If the line is dragged to produce a negative slope, does SSE increase or decrease?
- c Drag the line to obtain a line that visually fits the data well. What is the equation of the line that you obtained? What is the value of SSE? What happens to SSE if the slope (and intercept) of the line is changed from the one that you visually fit?
- d Is the line that you visually fit the least-squares line? Click on the button “Find Best Model” to obtain the line with smallest SSE. How do the slope and intercept of the least-squares line compare to the slope and intercept of the line that you visually fit in part (c)? How do the SSEs compare?
- e Refer to part (a). What is the y-coordinate of the point around which the blue line pivots?
- f Click on the button “Display/Hide Error Squares.” What do you observe about the size of the yellow squares that appear on the graph? What is the sum of the areas of the yellow squares?
11.2 Applet Exercise How can you improve your understanding of what the method of least-squares actually does? Access the applet Fitting a Line Using Least Squares (at academic.cengage.com/statistics/wackerly). The data that appear on the first graph is from Example 11.1.
- a What are the slope and intercept of the blue horizontal line? (See the equation above the graph.) What is the sum of the squares of the vertical deviations between the points on the horizontal line and the observed values of the y’s? Does the horizontal line fit the data well? Click the button “Display/Hide Error Squares.” Notice that the areas of the yellow boxes are equal to the squares of the associated deviations. How does SSE compare to the sum of the areas of the yellow boxes?
- b Click the button “Display/Hide Error Squares” so that the yellow boxes disappear. Place the cursor on right end of the blue line. Click and hold the mouse button and drag the line so that the slope of the blue line becomes negative. What do you notice about the lengths of the vertical red lines? Did SSE increase of decrease? Does the line with negative slope appear to fit the data well?
- c Drag the line so that the slope is near 0.8. What happens as you move the slope closer to 0.7? Did SSE increase or decrease? When the blue line is moved, it is actually pivoting around a fixed point. What are the coordinates of that pivot point? Are the coordinates of the pivot point consistent with the result you derive in Exercise 11.1?
- d Drag the blue line until you obtain a line that visually fits the data well. What are the slope and intercept of the line that you visually fit to the data? What is the value of SSE for the line that you visually fit to the data? Click the button “Find Best Model” to obtain the least-squares line. How does the value of SSE compare to the SSE associated with the line that you visually fit to the data? How do the slope and intercept of the line that you visually fit to the data compare to slope and intercept of the least-squares line?
11.1 If
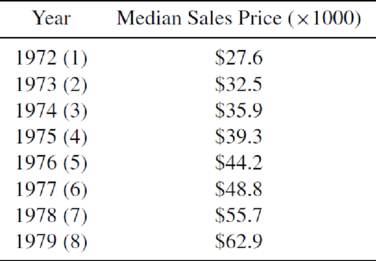
11.5 What did housing prices look like in the “good old days”? The median sale prices for new single-family houses are given in the accompanying table for the years 1972 through 1979. Letting Y denote the median sales price and x the year (using integers 1, 2, . . . , 8), fit the model Y = β0 + β1x + ε. What can you conclude from the results?
Want to see the full answer?
Check out a sample textbook solution
Chapter 11 Solutions
Mathematical Statistics with Applications


- Sales Barnes & Noble had annual sales of $6.8 billion in 2013 and $6.1 billion in 2015. Use the Midpoint Formula to estimate the sales in 2014. Assume that the annual sales followed a linear pattern.arrow_forwardHelp please!arrow_forwardAnswer Part 2. Don't forget least-square regression line. Dont skip numbers on the graph. (this 1,2,3,4, not 2,4,6)arrow_forward
- A study of fuel economy for various automobiles plotted the fuel consumption vs. speed. A LSRL was fit to the data. Here is the residual plot from this least-squares fit. What does the pattern of the residuals tell you about the linear model? 3. 2arrow_forwardUsing the guide of the textbook and your RQ, determine the equation of the least-square line for the following data: 1 6 3. Select the correct answer in the slope-intercept form. O y=-x+10.5 O y=-2x+11 O y=x O y=x+10 O x+y=11arrow_forwardDr. Chidi Anagonye studied how self-esteem (high versus low) and success on a school project (passed/succeeded or failed) influences whether students attribute the cause of the outcome to themselves or others. High scores on the dependent variable mean they attribute the outcome to themselves and low scores mean they attributed the outcome to others. Below are his results. Look at the graph below and select the statement that is most true about the graph: Attribution to Self 8 A 9 5 + 3 Low Self Esteem Success High Self Esteem O None of these are accurate Outcome There are 4 independent variables There is definitely an interaction There is definitely not an interaction Failurearrow_forward
- ov The scatterplot below shows the relationship between mass, x, in kilograms of a car and its fuel efficiency, y, in miles per gallon. The least-squares line is also shown on the scatterplot. The equation of the least-squares line is ŷ = 37.335 -0.00965x. Find the predicted and residual gas mileage for a car that weighs 1,500 kilograms and has a gas mileage of 20 miles per gallon. Fuel Efficiency and Mass for Cars Fuel Efficiency (mpg) 40 30 20 10 0 1,000 Mark this and return 2,000 Mass (kg) 3,000 4,000 Save and Exit MT tv Next AR Submitarrow_forwardFind the least squares line. Graph the data and the least squares line. 2 3 4. y - 1 3 5 (A) Find the least squares line. y= (Use integers or decimals for any numbers in the expression. Round to the nearest hundredth as needed.)arrow_forwardHelp please!arrow_forward

 Algebra: Structure And Method, Book 1AlgebraISBN:9780395977224Author:Richard G. Brown, Mary P. Dolciani, Robert H. Sorgenfrey, William L. ColePublisher:McDougal Littell
 Glencoe Algebra 1, Student Edition, 9780079039897...AlgebraISBN:9780079039897Author:CarterPublisher:McGraw Hill
 Linear Algebra: A Modern IntroductionAlgebraISBN:9781285463247Author:David PoolePublisher:Cengage Learning
 Big Ideas Math A Bridge To Success Algebra 1: Stu...AlgebraISBN:9781680331141Author:HOUGHTON MIFFLIN HARCOURTPublisher:Houghton Mifflin Harcourt
 Elementary Linear Algebra (MindTap Course List)AlgebraISBN:9781305658004Author:Ron LarsonPublisher:Cengage Learning