
Videos
a.
Obtain the null and the alternative hypotheses.
a.
Explanation of Solution
The null and alternative hypotheses are given below:
Null Hypothesis
That is, the mean of all treatments are equal.
Alternative Hypothesis
b.
Give the decision rule.
b.
Explanation of Solution
The treatment and error degrees of freedom are given below:
Treatment degrees of freedom:
Error degrees of freedom:
Here, the level of significance
Step-by-step procedure to obtain the critical F value using Excel-MegaStat:
- In EXCEL, Select Add-Ins > MegaStat > Probability.
- Choose probability> F-distribution> calculate F given probability.
- Enter P as 0.05.
- Enter df1 as 2.
- Enter df2 as 9.
- Click Ok.
Output using the Excel-MegaStat software is given below:
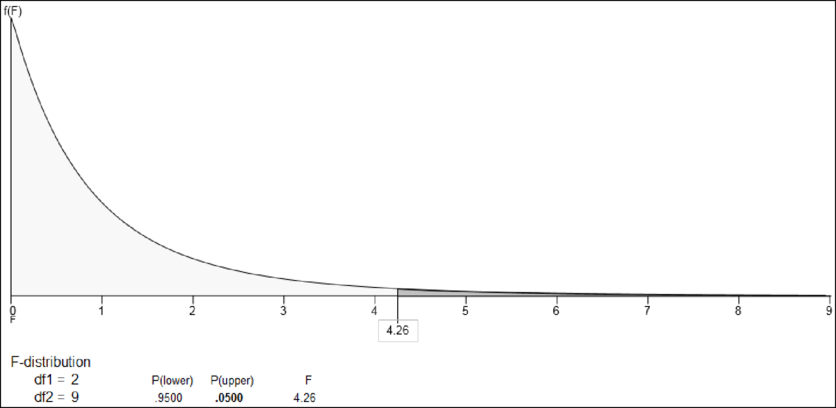
From the output, the critical F value is 4.26.
Decision rule:
If
Therefore, the decision rule is to reject
c.
Find the values of SST, SSE and SS total.
c.
Answer to Problem 11E
The value of SST is 107.20.
The value of SSE is 9.47.
The value of SS total is 116.67.
Explanation of Solution
Here, the level of significance
Step-by-step procedure to obtain the sum of square total, sum of square treatment and sum of square error using Excel-MegaStat:
- Choose MegStat > Analysis of Variance > One-Factor ANOVA.
- Select the column of Treatment 1, Treatment 2 and Treatment 3 in Input
range . - Click OK.
Output using the Excel-MegaStat software is given below:
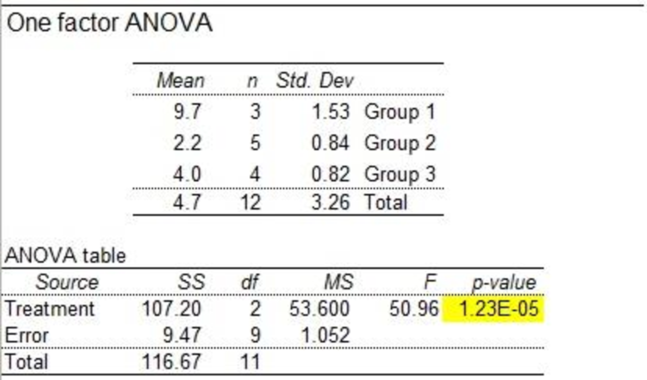
From the output, the values of SST is 107.20, SSE is 9.47 and SS total is 116.67.
d.
Find an ANOVA table.
d.
Explanation of Solution
From the output in Part (c), the ANOVA table is obtained.
The ANOVA table is given below:
| Source of Variation | Sum of Squares | Degrees of Freedom | Mean Square | F |
| Treatments | 107.2 | 2 | 53.6 | 50.96 |
| Error | 9.47 | 9 | 1.05 | |
| Total | 116.67 | 11 |
e.
Find the decision regarding the null hypothesis.
e.
Explanation of Solution
Conclusion:
The F value is 50.96 and the F critical value is 4.26.
Here, F value is greater than F critical value. That is, 50.96 > 4.26.
Using rejection rule, reject the null hypothesis.
Therefore, there is sufficient evidence that at least one mean of all treatment is differ from others.
f.
Check whether there is significant difference between treatment 1 and treatment 2, if null hypothesis is rejected by using the 95% level of confidence.
f.
Explanation of Solution
A 95% confidence interval is as follows:
Where,
From the output in Part (c), the mean of treatment 1 is 9.7, mean of treatment 2 is 2.2, and MSE is 1.052.
Step-by-step procedure to obtain t-critical value using Excel-MegaStat:
- In EXCEL, Select Add-Ins > MegaStat > Probability > t-Distribution.
- Select calculate t given P.
- Enter probability as 0.05.
- Enter df as 9.
- Under Shading, choose two-tail.
- Click Ok.
Output using the Excel-MegaStat software is given below:
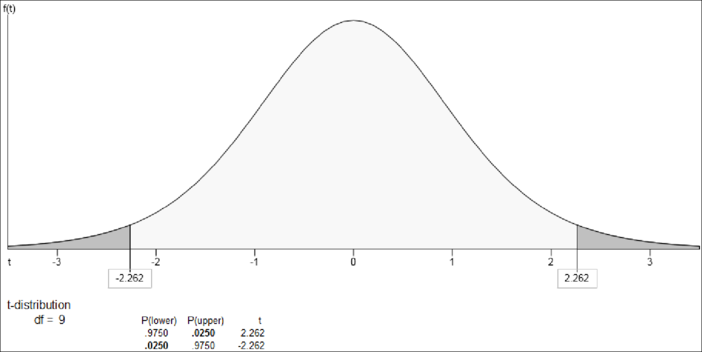
From the output, the t is
Therefore, a 95% confidence interval for that difference is 5.8 and 9.2. Here, 0 does not include in the confidence interval.
It means that there is a significant difference between the means of treatment 1 and treatment 2 because the endpoints have same sign or does not include zero.
Want to see more full solutions like this?
Chapter 12 Solutions
Loose Leaf for Statistical Techniques in Business and Economics


- Test the claim that the proportion of people who own cats is significantly different than 25% at the 0.02 significance level.The null and alternative hypothesis would be: H0:μ=0.25H0:μ=0.25Ha:μ≠0.25Ha:μ≠0.25 H0:p=0.25H0:p=0.25Ha:p<0.25Ha:p<0.25 H0:μ=0.25H0:μ=0.25Ha:μ<0.25Ha:μ<0.25 H0:p=0.25H0:p=0.25Ha:p≠0.25Ha:p≠0.25 H0:μ=0.25H0:μ=0.25Ha:μ>0.25Ha:μ>0.25 H0:p=0.25H0:p=0.25Ha:p>0.25Ha:p>0.25 The test is: left-tailed two-tailed right-tailed Based on a sample of 400 people, 80 owned cats What is p̂ (to 2 decimal places)? The test statistic is: (to 2 decimals)The p-value is: (to 4 decimals, if your p-value is less than 0.0001, you may enter 0))Based on this we: Fail to reject the null hypothesis Reject the null hypothesisarrow_forwardChantix (varenicline) is a drug used as an aid for those who want to stop smoking. The adverse reaction of nausea has been studied in clinical trials, and the table below summarizes results. Use a 0.01 significance level to test the claim that nausea is independent of whether the subject took a placebo or Chantix. Placebo Chantix Nausea 10 30 No Nausea 795 791 1.What is the conclusion of this study? 2.What is the decision rule of this study? 3. What is the computed Chi-square value?arrow_forwardA professor wanted to determine if the GPAS of students at Saddleback College are less consistent than the GPAS of students at Irvine Valley College. To test this, he obtains random samples of students from both colleges and records their GPAS, which are given below. Test the professor's claim at the a=0.05 level of significance. Saddleback College Irvine Valley College 3.7 3.2 3.0 2.5 2.7 3.6 4.0 3.4 3.8 3.2 3.0 2.5 3.6 2.8 2.6 2.5 2.1 2.7 3.9 3.4 2.0 2.2 2.7 3.1 2.0 2.0 2.1 3.8 3.1 2.9 3.2 2.8 Calculator Function [ Select] [ Select] 2-PropZTest ANOVA X^2-Test T-Test 2-SampTTest 2-SampFTest [ Select] v sufficient evidence that the standard deviation of grades for Saddleback College students is [ Select] than the standard deviation for Irvine Valley College students.arrow_forward
- The accompanying table lists body temperatures (in °F) obtained from randomly selected subjects. Using a 0.05 significance level, test for an interaction between gender and smoking, test for an effect from gender, and test for an effect from smoking. What do you conclude? Click the icon to view the body temperature data. First test for an interaction between the two factors. Determine the null and alternative hypotheses. Choose the correct answer below. A. Ho: Body temperatures are not affected by gender. H₁: Body temperatures are affected by gender. B. Ho: Body temperatures are not affected by an interaction between gender and smoking. H₁: Body temperatures are affected by an interaction between gender and smoking. C. Ho: Body temperatures are affected by an interaction between gender and smoking. H₁: Body temperatures are not affected by an interaction between gender and smoking. D. Ho: Body temperatures are not affected by smoking. H₁: Body temperatures are affected by smoking.…arrow_forwardTest the claim that the proportion of people who own cats is smaller than 90% at the 0.025 significance level.The null and alternative hypothesis would be: A. H0:μ=0.9 Ha:μ<0.9 B. H0:p=0.9 Ha:p>0.9 C. H0:μ=0.9 Ha:μ≠0.9 D. H0:p=0.9 Ha:p≠0.9 E. H0:μ=0.9 Ha:μ>0.9 F. H0:p=0.9 Ha:p<0.9 The standardized test is: two-tailed left-tailed right-tailed Based on a sample of 122 people, 81% owned catsThe test statistic is: (to 2 decimals)The P-value is: (to 4 decimals)Based on this we: Fail to reject the null hypothesis Reject the null hypothesisarrow_forwardTest the claim that the proportion of men who own cats is significantly different than 20% at the 0.2 significance level.The null and alternative hypothesis would be: H0:p=0.2H0:p=0.2H1:p≠0.2H1:p≠0.2 H0:μ=H0:μ=H1:μ>H1:μ> H0:μ=H0:μ=H1:μ<H1:μ< H0:μ=H0:μ=H1:μ≠H1:μ≠ H0:p=0.2H0:p=0.2H1:p>0.2H1:p>0.2 H0:p=0.2H0:p=0.2H1:p<0.2H1:p<0.2 The test is: left-tailed two-tailed right-tailed Based on a sample of 65 men, 17651765 of the men owned catsThe test statistic is: z=z= (to 2 decimals)The positive critical value is zC=zC=1.28155.Thus the test statistic in the critical region.Based on this we: Reject the null hypothesis Fail to reject the null hypothesisarrow_forward
- Test the claim that the proportion of people who own cats is significantly different than 80% at the 0.1 significance level.The null and alternative hypothesis would be: H0:μ=0.8H0:μ=0.8H1:μ≠0.8H1:μ≠0.8 H0:p=0.8H0:p=0.8H1:p≠0.8H1:p≠0.8 H0:p≤0.8H0:p≤0.8H1:p>0.8H1:p>0.8 H0:p≥0.8H0:p≥0.8H1:p<0.8H1:p<0.8 H0:μ≤0.8H0:μ≤0.8H1:μ>0.8H1:μ>0.8 H0:μ≥0.8H0:μ≥0.8H1:μ<0.8H1:μ<0.8 The test is: right-tailed left-tailed two-tailed Based on a sample of 200 people, 87% owned catsThe p-value is: (to 2 decimals)Based on this we: Reject the null hypothesis Fail to reject the null hypothesisarrow_forwardTest the claim that the proportion of men who own cats is significantly different than 30% at the 0.01 significance level. The null and alternative hypothesis would be: Ho:p = 0.3 Ho:p = 0.3 Ho:u = 0.3 Ho:µ = 0.3 Ho:p = 0.3 Ho:u = 0.3 H1:p # 0.3 H1:p > 0.3 H1:4 > 0.3 H1:µ < 0.3 H1:p < 0.3 H1:u + 0.3 The test is: left-tailed two-tailed right-tailed Based on a sample of 50 people, 22% owned cats The test statistic is: (to 2 decimals) The positive critical value is: (to 2 decimals) Based on this we: O Fail to reject the null hypothesis Reject the null hypothesisarrow_forwardTourism is extremely important to the economy of Florida. Hotel occupancy is an often-reported measure of visitor volume and visitor activity (Orlando Sentinel, May 19, 2018). Hotel occupancy data for February in two consecutive years are as follows. Current Year 1,394 1,700 Occupied Rooms Total Rooms a. Formulate the hypothesis test that can be used to determine whether there has been an increase in the proportion of rooms occupied over the one-year period. Let p₁ = population proportion of rooms occupied for current year P2 = population proportion of rooms occupied for previous year 0.82 Previous Year 1,404 1,800 Ho: P1 P2 less than or equal to 0 Ha P₁ P2 greater than 0 b. What is the estimated proportion of hotel rooms occupied each year (to 2 decimals)? Current year Previous Year c. Conduct a hypothesis test. What is the p-value (to 4 decimals)? Use Table 1 from Appendix B. 0.78arrow_forward
 College Algebra (MindTap Course List)AlgebraISBN:9781305652231Author:R. David Gustafson, Jeff HughesPublisher:Cengage Learning
 Glencoe Algebra 1, Student Edition, 9780079039897...AlgebraISBN:9780079039897Author:CarterPublisher:McGraw Hill