
Loose Leaf for Statistical Techniques in Business and Economics
17th Edition
ISBN: 9781260152647
Author: Douglas A. Lind
Publisher: McGraw-Hill Education
expand_more
expand_more
format_list_bulleted
Concept explainers
Videos
Textbook Question
Chapter 12, Problem 16E
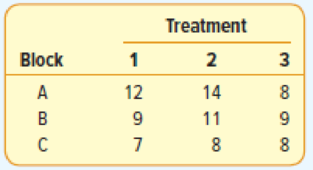
For exercises 15 and 16, conduct a test of hypothesis to determine whether the block or the treatment means differ. Using the .05 significance level: (a) state the null and alternate hypotheses for treatments; (b) state the decision rule for treatments; and (c) state the null and alternate hypotheses for blocks. Also, state the decision rule for blocks, then: (d) compute SST, SSB, SS total, and SSE; (e) complete an ANOVA table; and (f) give your decision regarding the two sets of hypotheses and interpret the results.
The following data was collected for a two-factor ANOVA with three treatments and three blocks.
Expert Solution & Answer
Want to see the full answer?
Check out a sample textbook solution
Students have asked these similar questions
None
Let p1 be the proportion of residents in Country A coping with depression, and let p2 be the proportion of residents in Country B coping with depression. What is the null hypothesis for a test to determine whether Country A has a greater proportion of residents coping with depression than Country B?
Select the correct answer below:
H0: p1−p2>0
H0: p1−p2<0
H0: p1−p2=0
H0: p1−p2≠0
With the information shown, Please do step 3 & 4 of the hypothesis testing
1.The number of people who survived the Titanic based on class and sex is collected is collected in the table. Is there enough evidence to show that the class and the sex of a person who survived the Titanic are independent? 0.05 significance level.
Null Hypothesis: class and sex of a person who survived the titanic are independent.
Alternative Hypothesis: class and sex of a person who survived the titanic are dependent.
The contingency table is:
Class
Male
Female
Total
1st
134
59
193
2nd
94
25
119
3rd
80
58
138
Total
308
142
450
Expected frequencies table is:
Class
Male
Female
Total
1st
193×308450=132.09
193×142450=60.90
193
2nd
119×308450=81.45…
Chapter 12 Solutions
Loose Leaf for Statistical Techniques in Business and Economics
Ch. 12 - Steele Electric Products Inc. assembles cell...Ch. 12 - What is the critical F value when the sample size...Ch. 12 - Prob. 2ECh. 12 - Prob. 3ECh. 12 - Prob. 4ECh. 12 - Prob. 5ECh. 12 - Prob. 6ECh. 12 - Prob. 2SRCh. 12 - Prob. 7ECh. 12 - Prob. 8E
Ch. 12 - Prob. 9ECh. 12 - Prob. 10ECh. 12 - Prob. 3SRCh. 12 - Prob. 11ECh. 12 - The following are six observations collected from...Ch. 12 - Prob. 13ECh. 12 - Prob. 14ECh. 12 - Prob. 4SRCh. 12 - Prob. 15ECh. 12 - For exercises 15 and 16, conduct a test of...Ch. 12 - Prob. 17ECh. 12 - Prob. 18ECh. 12 - Prob. 5SRCh. 12 - Prob. 19ECh. 12 - Prob. 20ECh. 12 - Prob. 21ECh. 12 - Prob. 22ECh. 12 - Prob. 23CECh. 12 - Prob. 24CECh. 12 - Prob. 25CECh. 12 - Prob. 26CECh. 12 - In an ANOVA table, the MSE is equal to 10. Random...Ch. 12 - Prob. 28CECh. 12 - Prob. 29CECh. 12 - Prob. 30CECh. 12 - Prob. 31CECh. 12 - Prob. 32CECh. 12 - Prob. 33CECh. 12 - Prob. 34CECh. 12 - Prob. 35CECh. 12 - Prob. 36CECh. 12 - Prob. 37CECh. 12 - Prob. 38CECh. 12 - Shanks Inc., a nationwide advertising firm, wants...Ch. 12 - Prob. 40CECh. 12 - Prob. 41CECh. 12 - Prob. 42CECh. 12 - Prob. 43CECh. 12 - Prob. 44CECh. 12 - Prob. 45CECh. 12 - Prob. 46CECh. 12 - Prob. 47CECh. 12 - Prob. 48CECh. 12 - Prob. 50DACh. 12 - Prob. 51DACh. 12 - Prob. 1PCh. 12 - Prob. 2PCh. 12 - Prob. 3PCh. 12 - Prob. 4PCh. 12 - Prob. 5PCh. 12 - Prob. 6PCh. 12 - Prob. 7PCh. 12 - Prob. 1CCh. 12 - Prob. 2CCh. 12 - Prob. 1.1PTCh. 12 - The likelihood of rejecting a true null hypothesis...Ch. 12 - Prob. 1.3PTCh. 12 - Prob. 1.4PTCh. 12 - Prob. 1.5PTCh. 12 - Prob. 1.6PTCh. 12 - In a two-tailed test, the rejection region is...Ch. 12 - Prob. 1.8PTCh. 12 - Prob. 1.9PTCh. 12 - Prob. 1.10PTCh. 12 - Prob. 2.1PTCh. 12 - Prob. 2.2PTCh. 12 - Prob. 2.3PT
Knowledge Booster


Learn more about
Need a deep-dive on the concept behind this application? Look no further. Learn more about this topic, statistics and related others by exploring similar questions and additional content below.Similar questions
- A research study wanted to examine whether religious belief and gender are related in their state. They selected a representative sample of men and women in their State.Select the null and alternative hypothesis of the test: A. H0: there is no relationship between gender and belief about human origins Ha: there is a relationship between gender and belief about human origins B. H0: there is a relationship between gender and belief about human origins Ha: there is no relationship between gender and belief about human origins Results of the study are summarized in this table for the Belief about human origins: religious texts evolutionary theory total male 30 36 66 female 108 89 197 total 138 125 263 The degrees of freedom for the the ?2 statistic are Round the following numbers to two places after the decimal:The test statistic is ?2 = with a p-value = The conclusion of the test at the 5% significance level is Gender and belief about human origins are…arrow_forwardThe following table contains the number of successes and failures for three categories of a variable. Test whether the proportions are equal for each category at the a = 0.1 level of significance. Category Category 2 Category Failures 34 78 44 Successes 24 50 88 EClick the icon to view the Chi-Square table of critical values. State the hypotheses. Choose the correct answer below A. H:The categories of the variable and success and failure are independent. H: The categories of the variable and success and failure are dependent. B. Ho H1 E and u2 E2 and H,: At least one mean is different from what is expected. H3 E3 C. H: The categories of the variable and success and failure are dependent H: The categories of the variable and success and failure are independent. OD. H: p. pp Click to select your answer(s).arrow_forwardThe following table contains the number of successes and failures for three categories of a variable. Test whether the proportions are equal for each category at the x = 0.01 level of significance. Category 1 Category 2 Category 3 Failures 39 83 47 Successes 30 65 38 Click the icon to view the Chi-Square table of critical values. State the hypotheses. Choose the correct answer below. OA. Ho: The categories of the variable and success and failure are independent. H₁: The categories of the variable and success and failure are dependent. OB. Ho: The categories of the variable and success and failure are dependent. H₁: The categories of the variable and success and failure are independent. C. Ho: P1 P2 P3 H₁: At least one of the proportions is different from the others. OD. Ho: H₁=E₁ and μ₂ = E₂ and μ3 = E3 H₁: At least one mean is different from what is expected. Compute the value of the chi-square test statistic. xo (Round to three decimal places as needed.)arrow_forward
- A research study wanted to examine whether religious belief and gender are related in their state. They selected a representative sample of men and women in their State.Select the null and alternative hypothesis of the test: H0: there is no relationship between gender and belief about human originsHa: there is a relationship between gender and belief about human origins H0: there is a relationship between gender and belief about human originsHa: there is no relationship between gender and belief about human origins Results of the study are summarized in this table for the Belief about human origins: religious texts evolutionary theory total male 30 36 66 female 110 89 199 total 140 125 265 The degrees of freedom for the the ?2 statistic are Round the following numbers to two places after the decimal:The test statistic is ?2 = with a p-value = The conclusion of the test at the 5% significance level is There is not enough statistical evidence to suggest that gender…arrow_forwardA teacher selects a random sample of 56 students from her large high school. For each student, she records the length of their hair and whether they play a sport. She would like to know if there is convincing evidence that hair length is associated with playing a sport. Let = 0.05. What are the hypotheses for this test? H0: Hair length is not independent of playing a sport.Ha: Hair length is independent of playing a sport. H0: Hair length is independent of playing a sport.Ha: Hair length is not independent of playing a sport. H0: There is an association between hair length and playing a sport.Ha: There is no association between hair length and playing a sport. H0: The proportion of students with differing hair lengths is not the same if they play sports.Ha: The proportion of students with differing hair lengths is the same if they play sportarrow_forwardFrom the table on the image: Construct an appropriate hypothesis test to determine whether or not there is an association between experiencing phenomena such as seeing a ghost and the age group you are in. Write the appropriate null/alternative hypothesis and carry out the test. Use a significance level of α = 0.01.arrow_forward
- Papa's Italian Restaurant has collected data about customer sauce orders. It calculated that P(marinara) = 0.74, P(pesto) = 0.62, and P(marinara or pesto) = 0.93. Determine P(marinara and pesto). 0.46 0.43 0.19 0.31arrow_forwardTest the claim that the proportion of people who own cats is significantly different than 80% at the 0.05 significance level.The null and alternative hypothesis would be:arrow_forwardThe manager of a fast food chain performs a hypothesis test at the significance level of0.10to determine if the proportion,p,of the orders that are taken at the fast food window is less than33%. These are the null hypothesish and the alternative hypothesish for the test. ho:p=0.33 h₁:p<0.33 (to) The result of the manager's hypothesis test will be to reject or not reject the null hypothesis,h.Yeahh is in fact true or false, fill in the following table to indicate whether the test result is correct, a type I error, or a type II error. Declineh 0 do not rejecth h it's true (Choose an option) Error type I Error type II Correct (CTOOSc an optiOfTJ standard normal distribution h it's false (Choose an option) (Choose an option) X S (b) The manager takes a random sample and determines that it is appropriate to use a Z test. The value of the test statistic isz=-1,654 (rounded to three decimal places). Draw the appropriate figure for the test.arrow_forward
- The director of student services at Oxnard College is interested in whether women are just as likely to attend orientation as men before they begin their coursework. A random sample of freshmen at Oxnard College were asked what their gender is and whether they attended orientation. The results of the survey are shown below: Data for Gender vs. Orientation Attendance Women Men Yes 355 No 247 395 239 What can be concluded at the a = 0.01 level of significance? For this study, we should use Select an answer a. The null and alternative hypotheses would be: Ho: Select an answer vSelect an answer v Select an answer v (please enter a decimal and note that p1 and ul represent the proportion and mean for women and p2 and u2 represent the proportion and mean for men.) H1: Select an answer Select an answer Select an answer | (Please enter a decimal) b. The test statistic ? v = (please show your answer to 3 decimal places.) c. The p-value = d. The p-value is ? a e. Based on this, we should Select…arrow_forwardRecall that a test is statistically significant at a particular significance level if the null hypothesis is rejected. If a test is statistically significant at 5% level of significance, then A the null hypothesis will also be rejected at 10% level of significance. B we cannot determine if the null hypothesis would be rejected at any other level of significance. C the null hypothesis will also be rejected at 1% level of significance. D the null hypothesis will not be rejected at 1% level of significance. E the null hypothesis will not be rejected at 10% level of significance.arrow_forwardA research company wants to determine whether there is a difference in effectiveness of a brand- name ibuprofen and generic ibuprofen. What are the appropriate hypotheses for this testing scenario? Let µ equal the mean of the effectiveness of brand-name ibuprofen and µ2 equal the mean of the effectiveness of generic ibuprofen. O Ho: H1 - H2 = 0 Hạ: H1 - H2 > 0 O Ho: H1 - µ2 = 0 Hạ: H1 - H2 0 O Ho: X1 - X2 = 0 Hạ: X1 - X2 + 0arrow_forward
arrow_back_ios
SEE MORE QUESTIONS
arrow_forward_ios
Recommended textbooks for you
 Glencoe Algebra 1, Student Edition, 9780079039897...AlgebraISBN:9780079039897Author:CarterPublisher:McGraw Hill
 Holt Mcdougal Larson Pre-algebra: Student Edition...AlgebraISBN:9780547587776Author:HOLT MCDOUGALPublisher:HOLT MCDOUGAL
Glencoe Algebra 1, Student Edition, 9780079039897...
Algebra
ISBN:9780079039897
Author:Carter
Publisher:McGraw Hill
Holt Mcdougal Larson Pre-algebra: Student Edition...
Algebra
ISBN:9780547587776
Author:HOLT MCDOUGAL
Publisher:HOLT MCDOUGAL
Hypothesis Testing - Solving Problems With Proportions; Author: The Organic Chemistry Tutor;https://www.youtube.com/watch?v=76VruarGn2Q;License: Standard YouTube License, CC-BY
Hypothesis Testing and Confidence Intervals (FRM Part 1 – Book 2 – Chapter 5); Author: Analystprep;https://www.youtube.com/watch?v=vth3yZIUlGQ;License: Standard YouTube License, CC-BY