
Concept explainers
Videos
In a study conducted by Zogby International for the Democrat and Chronicle, more than 700 New Yorkers were polled to determine whether the New York state government works. Respondents surveyed were asked questions involving pay cuts for state legislators, restrictions on lobbyists, term limits for legislators, and whether state citizens should be able to put matters directly on the state ballot for a vote. The results regarding several proposed reforms had broad support, crossing all demographic and political lines.
Suppose that a follow-up survey of 100 individuals who live in the western region of New York was conducted. The party affiliation (Democrat, Independent, Republican) of each individual surveyed was recorded, as well as their responses to the following three questions.
- 1. Should legislative pay be cut for every day the state budget is late?
Yes ____ No ____
- 2. Should there be more restrictions on lobbyists?
Yes ____ No ____
- 3. Should there be term limits requiring that legislators serve a fixed number of years?
Yes ____ No ____
The responses were coded using 1 for a Yes response and 2 for a No response. The complete data set is available in the file NYReform.
Managerial Report
- 1. Use
descriptive statistics to summarize the data from this study. What are your preliminary conclusions about the independence of the response (Yes or No) and party affiliation for each of the three questions in the survey? - 2. With regard to question 1, test for the independence of the response (Yes and No) and party affiliation. Use α = .05.
- 3. With regard to question 2, test for the independence of the response (Yes and No) and party affiliation. Use α = .05.
- 4. With regard to question 3, test for the independence of the response (Yes and No) and party affiliation. Use α = .05.
- 5. Does it appear that there is broad support for change across all political lines? Explain.
1.
Find the descriptive statistics to summarize the data from the study.
Explain about the preliminary conclusions about the independence of the response and party affiliation for each of the three questions in the survey.
Explanation of Solution
Calculation:
The given data are related to the survey of 100 individuals, who were asked three questions. The response was coded using “1” for “Yes” response and “2” for “No” response.
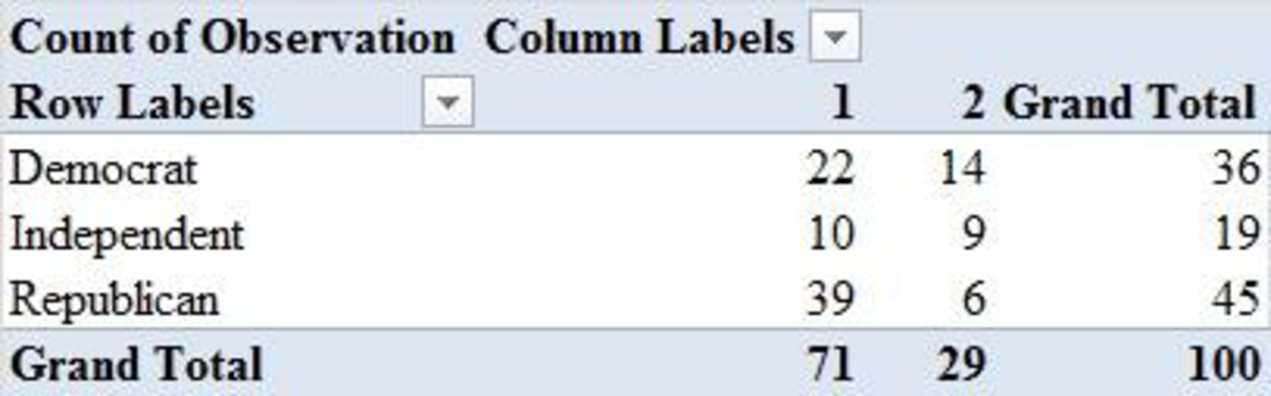
The variable ‘Pay Cut?’ represents the response of the question “Should legislative pay be cut for every day the state budget is late?”.
Contingency table:
Software procedure:
Step-by-step software procedure to obtain contingency table using EXCEL software is as follows:
- Open an EXCEL sheet.
- Enter the data as Observation in column A, Party in column B, Pay Cut? in column C, Lobbyists? in column D and Term Limits? in column E.
- Select the all data.
- Choose Insert > PivotTable.
- Under Select a table or range in Table/Range enter Data!$A$1:$E$101.
- Choose New Worksheet.
- Click OK.
- In new sheet enter Party as Row Labels.
- In new sheet enter Pay Cut? as Column Labels.
- In new sheet enter Observation as Values.
- Choose Values > Sum of Observation > Value Field Settings.
- Select Summarize value field by > Count.
- Click OK.
- Output using EXCEL software is given below:
Now, the percentages of responses for the question “Should legislative pay be cut for every day the state budget is late?” are obtained as follows:
| Party | Yes (%) | No (%) |
| Democrat | ||
| Independent | ||
| Republican |
Thus, it can be concluded that since the percentage of Republicans that answered yes is much greater than the percentage of Democrats or Independents that answered yes, the classifications do not appear to be independent.
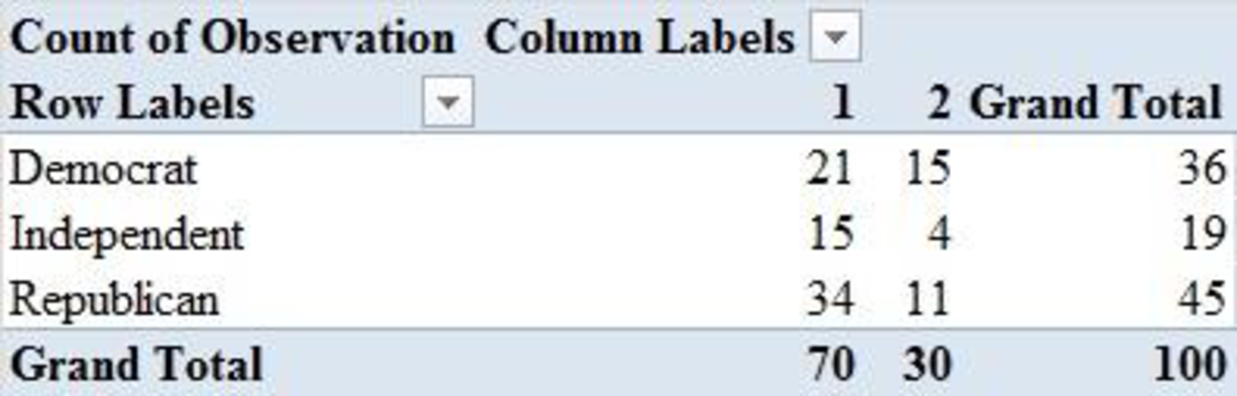
The variable ‘Lobbyists?’ represents the response of the question “Should there be more restriction on lobbyists?”.
Software procedure:
Step-by-step software procedure to obtain contingency table using EXCEL software is as follows:
- Open an EXCEL sheet.
- Enter the data as Observation in column A, Party in column B, Pay Cut? in column C, Lobbyists? in column D and Term Limits? in column E.
- Select the all data.
- Choose Insert > PivotTable.
- Under Select a table or range in Table/Range enter Data!$A$1:$E$101.
- Choose New Worksheet.
- Click OK.
- In new sheet enter Party as Row Labels.
- In new sheet enter Lobbyists? as Column Labels.
- In new sheet enter Observation as Values.
- Choose Values > Sum of Observation > Value Field Settings.
- Select Summarize value field by > Count.
- Click OK.
- Output using EXCEL software is given below:
Now, the percentages of responses for the question “Should there be more restriction on lobbyists?” are obtained as follows:
| Party | Yes (%) | No (%) |
| Democrat | ||
| Independent | ||
| Republican |
Thus, it can be concluded that since the percentage of Democrats that answered yes is much less than the percentage of Independents or Republicans that answered yes, the classifications do not appear to be independent.
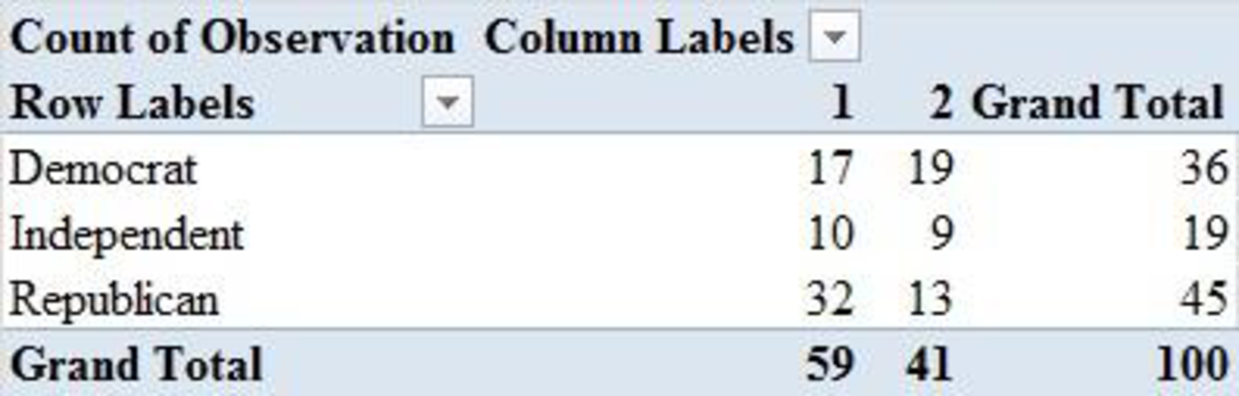
The variable ‘Term Limits?’ represents the response of the question “Should there be term limits requiring that legislators serve a fixed number of years?”.
Contingency table:
Software procedure:
Step-by-step software procedure to obtain contingency table using EXCEL software is as follows:
- Open an EXCEL sheet.
- Enter the data as Observation in column A, Party in column B, Pay Cut? in column C, Lobbyists? in column D and Term Limits? in column E.
- Select the all data.
- Choose Insert > PivotTable.
- Under Select a table or range in Table/Range enter Data!$A$1:$E$101.
- Choose New Worksheet.
- Click OK.
- In new sheet enter Party as Row Labels.
- In new sheet enter Term Limits? as Column Labels.
- In new sheet enter Observation as Values.
- Choose Values > Sum of Observation > Value Field Settings.
- Select Summarize value field by > Count.
- Click OK.
- Output using EXCEL software is given below:
Now, the percentages of responses for the question “Should there be term limits requiring that legislators serve a fixed number of years?” are obtained as follows:
| Party | Yes (%) | No (%) |
| Democrat | ||
| Independent | ||
| Republican |
Thus, it can be concluded that since the percentage of Republicans that answered yes is much higher than the percentage of Democrats or Independents that answered yes, the classifications do not appear to be independent.
2.
Perform a test for the independence of the response (Yes or No) and party affiliation with regard to question “Should legislative pay be cut for every day the state budget is late?” at
Answer to Problem 1CP
There is a statistically significant relation between the response (Yes or No) and party affiliation.
Explanation of Solution
Calculation:
State the test hypotheses.
Null hypothesis:
That is, there is no statistically significant relation between the response (Yes or No) and party affiliation.
Alternative hypothesis:
That is, there is a statistically significant relation between the response (Yes or No) and party affiliation.
The row and column total is tabulated below:
| Party | Yes (%) | No (%) | Total |
| Democrat | 22 | 14 | 36 |
| Independent | 10 | 9 | 19 |
| Republican | 39 | 6 | 45 |
| Total | 71 | 29 | 100 |
The formula for expected frequency is given below:
The expected frequency for each category is calculated as follows:
| Party | Yes (%) | No (%) |
| Democrat | ||
| Independent | ||
| Republican |
The formula for chi-square test statistic is given as,
Therefore, the value of chi-square test statistic is,
Thus, the chi-square test statistic is 10.18.
Degrees of freedom:
The degrees of freedom are
Thus, for 3 rows and 2 columns the degrees of freedom are,
Thus, the degree of freedom is 2.
Level of significance:
The given level of significance is
p-value:
Software procedure:
Step -by-step software procedure to obtain p-value using EXCEL software is as follows:
- Open an EXCEL sheet and select cell A1.
- In cell A1 enter the formula =CHISQ.DIST.RT(10.18,2).
- Press Enter.
- Output using EXCEL software is given below:
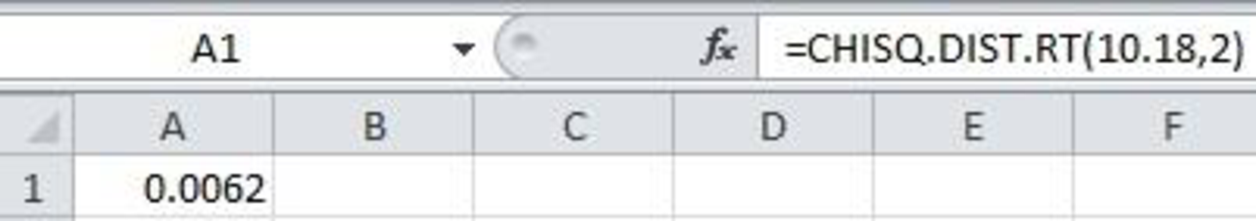
From the EXCEL output, the p-value is 0.0062.
Rejection rule:
- If the
- Otherwise, failed to reject the null hypothesis.
Conclusion:
Here, the p-value is less than the level of significance.
That is,
Thus, the decision is “reject the null hypothesis”.
Therefore, the data provide sufficient evidence to conclude that the responses and party affiliation are not independent.
Thus, there is a statistically significant relation between the response (Yes or No) and party affiliation.
3.
Perform a test for the independence of the response (Yes or No) and party affiliation with regard to question “Should there be more restriction on lobbyists?” at
Answer to Problem 1CP
There is no statistically significant relation between the response (Yes or No) and party affiliation.
Explanation of Solution
Calculation:
State the test hypotheses.
Null hypothesis:
That is, there is no statistically significant relation between the response (Yes or No) and party affiliation.
Alternative hypothesis:
That is, there is no statistically significant relation between the response (Yes or No) and party affiliation.
The row and column total is tabulated below:
| Party | Yes (%) | No (%) | Total |
| Democrat | 21 | 15 | 36 |
| Independent | 15 | 4 | 19 |
| Republican | 34 | 11 | 45 |
| Total | 70 | 30 | 100 |
The formula for expected frequency is given below:
The expected frequency for each category is calculated as follows:
| Party | Yes (%) | No (%) |
| Democrat | ||
| Independent | ||
| Republican |
Therefore, the value of chi-square test statistic is,
Thus, the chi-square test statistic is 3.72.
Degrees of freedom:
The degrees of freedom are
Thus, for 3 rows and 2 columns the degrees of freedom are,
Thus, the degree of freedom is 2.
Level of significance:
The given level of significance is
p-value:
Software procedure:
Step -by-step software procedure to obtain p-value using EXCEL software is as follows:
- Open an EXCEL sheet and select cell A1.
- In cell A1 enter the formula =CHISQ.DIST.RT(3.72,2).
- Press Enter.
- Output using EXCEL software is given below:
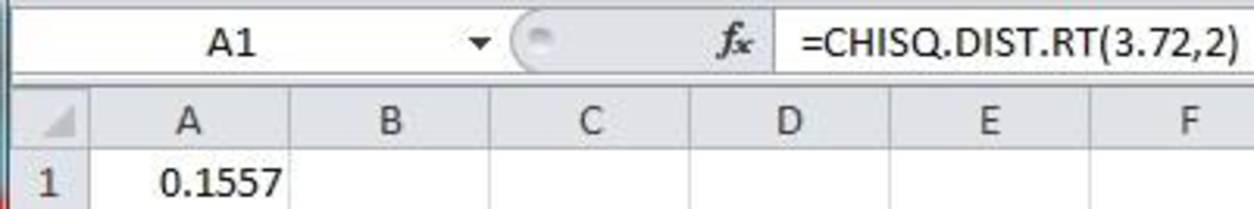
From the EXCEL output, the p-value is 0.1557.
Conclusion:
Here, the p-value is greater than the level of significance.
That is,
Thus, the decision is “Do not reject the null hypothesis”.
Therefore, the data do not provide sufficient evidence to conclude that the responses and party affiliation are not independent.
Thus, there is no statistical significant relation between the response (Yes or No) and party affiliation.
4.
Perform a test for the independence of the response (Yes or No) and party affiliation with regard to question “Should there be term limits requiring that legislators serve a fixed number of years?” at
Answer to Problem 1CP
There is no statistically significant relation between the response (Yes or No) and party affiliation.
Explanation of Solution
Calculation:
State the test hypotheses.
Null hypothesis:
That is, there is no statistical significant relation between the response (Yes or No) and party affiliation.
Alternative hypothesis:
That is, there is a statistically significant relation between the response (Yes or No) and party affiliation.
The row and column total is tabulated below:
| Party | Yes (%) | No (%) | Total |
| Democrat | 17 | 19 | 36 |
| Independent | 10 | 9 | 19 |
| Republican | 32 | 13 | 45 |
| Total | 59 | 41 | 100 |
The formula for expected frequency is given below:
The expected frequency for each category is calculated as follows:
| Party | Yes (%) | No (%) |
| Democrat | ||
| Independent | ||
| Republican |
Therefore, the value of chi-square test statistic is,
Thus, the chi-square test statistic is 5.21.
Degrees of freedom:
The degrees of freedom are
Thus, for 3 rows and 2 columns the degrees of freedom are,
Thus, the degree of freedom is 2.
Level of significance:
The given level of significance is
p-value:
Software procedure:
Step -by-step software procedure to obtain p-value using EXCEL software is as follows:
- Open an EXCEL sheet and select cell A1.
- In cell A1 enter the formula =CHISQ.DIST.RT(5.21,2).
- Press Enter.
- Output using EXCEL software is given below:
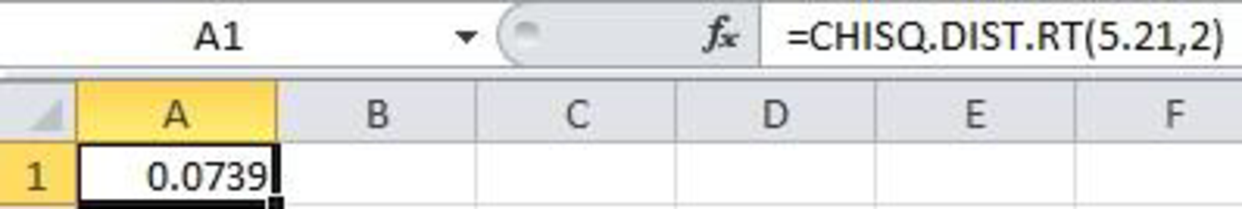
From the EXCEL output, the p-value is 0.0739.
Conclusion:
Here, the p-value is greater than the level of significance.
That is,
Thus, the decision is “Fail to reject the null hypothesis”.
Therefore, the data do not provide sufficient evidence to conclude that the responses and party affiliation are not independent.
Thus, there is no statistically significant relation between the response (Yes or No) and party affiliation.
5.
Explain whether it appears that there is broad support for change across all political lines.
Explanation of Solution
The tests conducted in Parts 3 and 4 do not produce significant p-values and imply that there is no dependence between the party affiliation and opinions regarding the restriction for lobbyists and term limits of legislators.
However, the test conducted in Part 2 suggests that there is a significant relationship between one’s party affiliation and their opinion regarding legislative pay cut. The Republicans appear to be much more in favor of legislative pay cut for everyday state budget than the Democrats or the Independents.
Thus, it appears that there is no broad support for change across all political lines, but only across some political lines.
Want to see more full solutions like this?
Chapter 12 Solutions
EBK MODERN BUSINESS STATISTICS WITH MIC


- In recent years, many states have enacted tougher voter identification laws requiring a government issued photo ID. Proponents claim that these laws are necessary to reduce voter fraud. Opponents claim that voter fraud is rare and that since as many as 11% of eligible voters do not have the required identification, these tougher laws will discourage millions of minorities and low-income Americans from voting. The Washington Post conducted a national poll (July 7-19, 2012) and found that 1558 out of 2064 adults supported the tougher voter ID laws. 1)Construct a 95% confidence interval for the proportion of adults who approve of tougher voter ID laws. Document your work in the space provided below. Document how you computed the margin of error and the confidence interval in the space provided below. Round all numbers to 4 decimal places. 2)Is it likely that three-fourths of adults approve of these new laws?arrow_forwardA state highway commission is considering removing the lane that allows people to pay cash for a toll on a toll road and requiring all people who use the toll road to pay with an electronic transponder that is connected to their car. The commission wants to know whether the proportion of people who live in the northern part of the state and are in favor of removing the cash lane is different from the proportion of people who live in the southern part of the state and are in favor of removing the cash lane. Independent random samples are selected from the northern and southern parts of the state. The table summarizes the responses of those surveyed. Northern Southern Total Remove Cash Lanes 112 98 210 Keep Cash Lanes 89 105 194 Total 201 203 404 Which of the following is closest to the pp-value of the appropriate test to investigate whether the proportion of people living in the northern part of the state who are in favor of removing the cash lane is different from…arrow_forward
 MATLAB: An Introduction with ApplicationsStatisticsISBN:9781119256830Author:Amos GilatPublisher:John Wiley & Sons Inc
 Probability and Statistics for Engineering and th...StatisticsISBN:9781305251809Author:Jay L. DevorePublisher:Cengage Learning
 Statistics for The Behavioral Sciences (MindTap C...StatisticsISBN:9781305504912Author:Frederick J Gravetter, Larry B. WallnauPublisher:Cengage Learning
 Elementary Statistics: Picturing the World (7th E...StatisticsISBN:9780134683416Author:Ron Larson, Betsy FarberPublisher:PEARSON
 The Basic Practice of StatisticsStatisticsISBN:9781319042578Author:David S. Moore, William I. Notz, Michael A. FlignerPublisher:W. H. Freeman
 Introduction to the Practice of StatisticsStatisticsISBN:9781319013387Author:David S. Moore, George P. McCabe, Bruce A. CraigPublisher:W. H. Freeman