
Introduction To Statistics And Data Analysis
6th Edition
ISBN: 9781337793612
Author: PECK, Roxy.
Publisher: Cengage Learning,
expand_more
expand_more
format_list_bulleted
Videos
Textbook Question
Chapter 12, Problem 33CR
The color vision of birds plays a role in their foraging behavior: Birds use color to select and avoid certain types of food. The authors of the article “Colour Avoidance in Northern Bobwhites: Effects of Age, Sex, and Previous Experience” (Animal Behaviour [1995]: 519–526) studied the pecking behavior of 1-day-old bobwhites. In an area painted white, they inserted four pins with different colored heads. The color of the pin chosen on the bird’s first peck was noted for each of 33 bobwhites, resulting in the accompanying table.
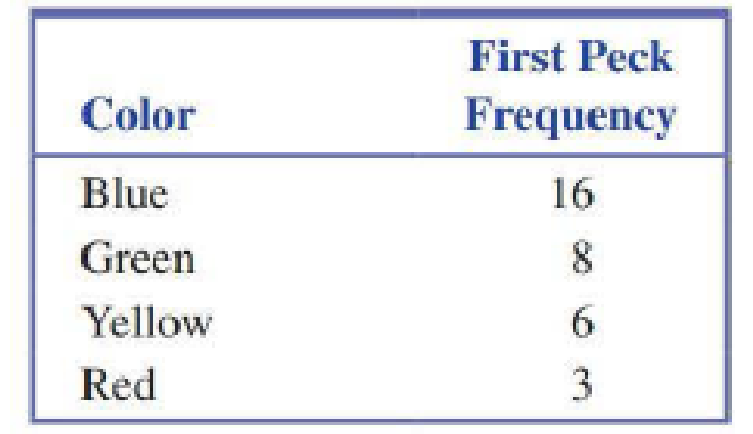
Do the data provide evidence of a color preference? Test using α = 0.01.
Expert Solution & Answer

Trending nowThis is a popular solution!

Students have asked these similar questions
Based on a survey of 12,344 U.S. college students and 6,729 Canadian college students, Kuo, Adlaf, Lee, Gliksman, Demers, and Wechsler (2002) report that alcohol use is more common among Canadian than U.S. students, but heavy drinking (five or more drinks in a row for males, four or more for females) is significantly higher among U.S. students than Canadian students.
Is this an example of a survey research design?
In the book Business Research Methods (5th ed.), Donald R. Cooper and C. William Emory discuss studying the relationship between on-the-job accidents and smoking. Cooper and Emory describe the study as follows:
Suppose a manager implementing a smoke-free workplace policy is interested in whether smoking affects worker accidents. Since the company has complete reports of on-the-job accidents, she draws a sample of names of workers who were involved in accidents during the last year. A similar sample from among workers who had no reported accidents in the last year is drawn. She interviews members of both groups to determine if they are smokers or not.
The sample results are given in the following table.
On-the-Job Accident
Smoker
Yes
No
Row Total
Heavy
12
5
17
Moderate
9
10
19
Nonsmoker
13
17
30
Column total
34
32
66
Expected counts are below observed counts
Accident
No Accident
Total
Heavy
12
5
17
8.76
8.24…
A school psychologist is interested in whether going to nature school, where children spend their day outside working with nature, versus public school has an effect on children's empathy toward their peers. A national survey of public schools found that, on a scale from 1 to 10, the average empathy among all
children in public schools was 5 (u = 5.00). The school psychologist randomly
selects 4 children from a nature school, measures their empathy toward their peers, and obtains the following scores:
10, 9, 10, 7
Using the appropriate hypothesis test and the six steps of hypothesis testing, see what the school psychologist should conclude about the difference in empathy between children who attend nature school versus children who attend public school.
1. What is the appropriate test to use ?
2. List the test's assumptions You do NOT have to test the assumptions.
3. What are the null and alternative hypotheses ?
4. Construct a sampling distribution of means representing the null…
Chapter 12 Solutions
Introduction To Statistics And Data Analysis
Ch. 12.1 - A particular cell phone case is available in a...Ch. 12.1 - From the given information in each case below, use...Ch. 12.1 - In 2014, the University of Houston carried out a...Ch. 12.1 - The Global Automotive 2016 Color Popularity Report...Ch. 12.1 - A popular urban legend is that more babies than...Ch. 12.1 - The authors of the paper External Factors and the...Ch. 12.1 - The authors of the paper Is It Really About Me?...Ch. 12.1 - The article In Bronx, Hitting Home Runs Is A...Ch. 12.1 - The authors of the paper Racial Stereotypes in...Ch. 12.1 - The paper Sociochemosensory and Emotional...
Ch. 12.1 - How would you answer the following question: Next...Ch. 12.1 - USA Today (Hybrid Car Sales Rose 81% Last Year,...Ch. 12.1 - A certain genetic characteristic of a particular...Ch. 12.2 - A particular state university system has six...Ch. 12.2 - A random sample of 1000 registered voters in a...Ch. 12.2 - Prob. 16ECh. 12.2 - Some colleges now allow students to pay their...Ch. 12.2 - The Knight Foundation asked each person in a...Ch. 12.2 - The Knight Foundation investigated whether high...Ch. 12.2 - Each person in a representative sample of 445...Ch. 12.2 - The report Education Pays 2016 (The College...Ch. 12.2 - The report Consumer Revolving Credit and Debt Over...Ch. 12.2 - Prob. 23ECh. 12.2 - The authors of the paper Movie Character Smoking...Ch. 12.2 - The data summarized in the accompanying table are...Ch. 12.2 - The paper Credit Card Misuse, Money Attitudes, and...Ch. 12.2 - Each person in a large sample of German...Ch. 12.2 - Can people tell the difference between a female...Ch. 12.3 - The following passage is from the paper Gender...Ch. 12.3 - The article titled Nap Time...Ch. 12.3 - Using data from a national survey, the authors of...Ch. 12 - Each observation in a random sample of 100 bicycle...Ch. 12 - The color vision of birds plays a role in their...Ch. 12 - Prob. 34CRCh. 12 - Prob. 35CRCh. 12 - Prob. 36CR
Knowledge Booster


Learn more about
Need a deep-dive on the concept behind this application? Look no further. Learn more about this topic, statistics and related others by exploring similar questions and additional content below.Similar questions
- A school psychologist is interested in whether going to nature school, where children spend their day outside working with nature, versus public school has an effect on children's empathy toward their peers. A national survey of public schools found that, on a scale from 1 to 10, the average empathy among all children in public schools was 5 (u = 5.00). The school psychologist randomly selects 4 children from a nature school, measures their empathy toward their peers, and obtains the following scores: 10, 9, 10, 7 Using the appropriate hypothesis test and the six steps of hypothesis testing, see what the school psychologist should conclude about the difference in empathy between children who attend nature school versus children who attend public school. 3. What are the null and alternative hypotheses ? 4. Construct a sampling distribution of means representing the null hypothesis. Specify the sampling distribution's mean and standard error 5. Using a two-tailed alpha of .05 (a=0.5)…arrow_forwardA school psychologist is interested in whether going to nature school, where children spend their day outside working with nature, versus public school has an effect on children's empathy toward their peers. A national survey of public schools found that, on a scale from 1 to 10, the average empathy among all children in public schools was 5 (u = 5.00). The school psychologist randomly selects 4 children from a nature school, measures their empathy toward their peers, and obtains the following scores: 10, 9, 10, 7 Using the appropriate hypothesis test and the six steps of hypothesis testing, see what the school psychologist should conclude about the difference in empathy between children who attend nature school versus children who attend public school. 1. What is the appropriate test to use? 2. List the test's assumptions You do NOT have to test the assumptions. 3. What are the null and alternative hypotheses? 4. Construct a sampling distribution of means representing the null…arrow_forwardA study in Sweden looked at former elite soccer players, people who had played soccer but not at the elite level, and people of the same age who did not play soccer. Here is a two-way table that classifies these subjects by whether or not they had arthritis of the hip or knee by their mid-fifties: Elite Non-elite Did not play Arthritis 10 9 24 No arthritis 61 206 548 Based on this study, you can conclude thatarrow_forward
- A survey of 2645 consumers by DDB Needham Worldwide of Chicago for public relations agency Porter/Novelli showed that how a company handles a crisis when at fault is one of the top influences in consumer buying decisions, with 73% claiming it is an influence. Quality of product was the number one influence, with 96% of consumers stating that quality influences their buying decisions. How a company handles complaints was number two, with 85% of consumers reporting it as an influence in their buying decisions. Suppose a random sample of 1,100 consumers is taken and each is asked which of these three factors influence their buying decisions. Appendix A Statistical Tables https://education.wiley.com/was/ui/v2/assessment-player/index.html?launchId=2333882f-0c41-4ee5-8a4b-7f87d5b49481# a. What is the probability that more than 810 consumers claim that how a company handles a crisis when at fault is an influence in their buying decisions?b. What is the probability that fewer than 1,030…arrow_forwardA survey of 2645 consumers by DDB Needham Worldwide of Chicago for public relations agency Porter/Novelli showed that how a company handles a crisis when at fault is one of the top influences in consumer buying decisions,with 73% claiming it is an influence. Quality of product was the number one influence, with 96% of consumers stating that quality influences their buying decisions. How a company handles complaints was number two, with 85% of consumers reporting it as an influence in their buying decisions. Suppose a random sample of 1,200 consumers is taken and each is asked which of these three factors influence their buying decisions. Appendix A Statistical Tables a. What is the probability that more than 920 consumers claim that how a company handles a crisis when at fault is an influence in their buying decisions?b. What is the probability that fewer than 1,125 consumers claim that quality of product is an influence in their buying decisions?c. What is the probability that between…arrow_forwardA survey of 2645 consumers by DDB Needham Worldwide of Chicago for public relations agency Porter/Novelli showed that how a company handles a crisis when at fault is one of the top influences in consumer buying decisions, with 73% claiming it is an influence. Quality of product was the number one influence, with 96% of consumers stating that quality influences their buying decisions. How a company handles complaints was number two, with 85% of consumers reporting it as an influence in their buying decisions. Suppose a random sample of 1,100 consumers is taken and each is asked which of these three factors influence their buying decisions. Appendix A Statistical Tables a. What is the probability that more than 810 consumers claim that how a company handles a crisis when at fault is an influence in their buying decisions?b. What is the probability that fewer than 1,030 consumers claim that quality of product is an influence in their buying decisions?c. What is the probability that…arrow_forward
- For an experiment on influencing the choices of others by offering undesirable alternatives, each of 103 college students selected three portable grills from five to display on a showroom floor. The students were instructed to include Grill #2 (a smaller-sized grill) and select the remaining two grills in the display to maximize purchases of Grill #2. If the six possible grill display combinations (1-2-3, 1-2-4, 1-2-5, 2-3-4, 2-3-5, and 2-4-5) were selected at random, then the proportion of students selecting any display was 1/6=0.167. One theory tested by the researcher was that the students would tend to choose the three-grill display so that Grill #2 was a compromise between a more desirable and a less desirable grill(that is, display 1-2-3, 1-2-4, or 1-2-5). Of the 103 students, 57 selected a three-grill display that was consistent with this theory. Use this information to test the theory proposed by the researcher at α=0.01. 1. Identify the test statistic, z.…arrow_forwardAnother experiment involving processor speed (Sp) and size of random access memory (RAM) for computers produced the following data Sp1 Sp2 RAM 1 48 37 38 35 37 39 RAM 2 30 35 31 22 26 30 Are the factors Sp and RAM or their interaction statistically significant?arrow_forwardDo well-rounded people get fewer colds? A study on the Chronicle of Higher Education was conducted by scientist at Carnegie Mellon University, the University of Pittsburgh and the University of Virginia. They found that people who have only a few social outlets get more colds than those who are involved in a variety of social activities. Suppose that of the 276 healthy men and women tested, n1=96 had only a few social outlets and n2=105 were busy with six or more activities. When these people were exposed to a cold virus, the following results were observed: Construct a 99% confidence interval for the difference in the two population proportions.arrow_forward
- In the journal Mental Retardation, an article reported the results of a peer tutoring program to help mildly mentally retarded children learn to read. In the experiment, the mildly retarded children were randomly divided into two groups: the experimental group received peer tutoring along with regular instruction, and the control group received regular instruction with no peer tutoring. There were n1 = n2 = 30 children in each group. The Gates-MacGintie Reading Test was given to both groups before instruction began. For the experimental group, the mean score on the vocabulary portion of the test was x1 = 344.5, with sample standard deviation s1 = 49.1. For the control group, the mean score on the same test was x2 = 353.8, with sample standard deviation s2 = 50.5. Use a 5% level of significance to test the hypothesis that there was no difference in the vocabulary scores of the two groups before the instruction began. (a) What is the level of significance? (b) What is the value of the…arrow_forward6. In the book Business Research Methods (5th ed.), Donald R. Cooper and C. William Emory discuss studying the relationship between on-the-job accidents and smoking. Cooper and Emory describe the study as follows: Suppose a manager implementing a smoke-free workplace policy is interested in whether smoking affects worker accidents. Since the company has complete reports of on-the-job accidents, she draws a sample of names of workers who were involved in accidents during the last year. A similar sample from among workers who had no reported accidents in the last year is drawn. She interviews members of both groups to determine if they are smokers or not. The sample results are given in the following table.arrow_forwardThe following data are taken from an experiment in which the subjects were tested for motion sickness. Thesubjects were randomly assigned to either the control group which was given a placebo or the experimentalgroup which was given the drug Astemizole and observed on an ocean voyage. The same subjects were thenswitched and those that had the placebo were now given the drug, and those that had the drug were nowgiven a placebo and observed on a new ocean voyage taking the same course. The results are the number ofhead movements that the subjects could endure without becoming nauseous. Use α = 0.05 to test the claimthat Astemizole is effective, i.e. it takes a larger number of head movements before the subject getsnauseous.Control 19 45 36 42 38 31 30 40 41 35Drug 20 55 36 45 40 32 41 38 44 29 1) State the hypotheses and identify the claim. Group 1 is the Control group. 2)Find the test statistic and Find the p-value. 3)Make the decision and Summarize the results.arrow_forward
arrow_back_ios
SEE MORE QUESTIONS
arrow_forward_ios
Recommended textbooks for you
 MATLAB: An Introduction with ApplicationsStatisticsISBN:9781119256830Author:Amos GilatPublisher:John Wiley & Sons Inc
 Probability and Statistics for Engineering and th...StatisticsISBN:9781305251809Author:Jay L. DevorePublisher:Cengage Learning
 Statistics for The Behavioral Sciences (MindTap C...StatisticsISBN:9781305504912Author:Frederick J Gravetter, Larry B. WallnauPublisher:Cengage Learning
 Elementary Statistics: Picturing the World (7th E...StatisticsISBN:9780134683416Author:Ron Larson, Betsy FarberPublisher:PEARSON
 The Basic Practice of StatisticsStatisticsISBN:9781319042578Author:David S. Moore, William I. Notz, Michael A. FlignerPublisher:W. H. Freeman
 Introduction to the Practice of StatisticsStatisticsISBN:9781319013387Author:David S. Moore, George P. McCabe, Bruce A. CraigPublisher:W. H. Freeman
MATLAB: An Introduction with Applications
Statistics
ISBN:9781119256830
Author:Amos Gilat
Publisher:John Wiley & Sons Inc
Probability and Statistics for Engineering and th...
Statistics
ISBN:9781305251809
Author:Jay L. Devore
Publisher:Cengage Learning
Statistics for The Behavioral Sciences (MindTap C...
Statistics
ISBN:9781305504912
Author:Frederick J Gravetter, Larry B. Wallnau
Publisher:Cengage Learning
Elementary Statistics: Picturing the World (7th E...
Statistics
ISBN:9780134683416
Author:Ron Larson, Betsy Farber
Publisher:PEARSON
The Basic Practice of Statistics
Statistics
ISBN:9781319042578
Author:David S. Moore, William I. Notz, Michael A. Fligner
Publisher:W. H. Freeman
Introduction to the Practice of Statistics
Statistics
ISBN:9781319013387
Author:David S. Moore, George P. McCabe, Bruce A. Craig
Publisher:W. H. Freeman
Hypothesis Testing using Confidence Interval Approach; Author: BUM2413 Applied Statistics UMP;https://www.youtube.com/watch?v=Hq1l3e9pLyY;License: Standard YouTube License, CC-BY
Hypothesis Testing - Difference of Two Means - Student's -Distribution & Normal Distribution; Author: The Organic Chemistry Tutor;https://www.youtube.com/watch?v=UcZwyzwWU7o;License: Standard Youtube License