
Concept explainers
Videos
A popular urban legend is that more babies than usual are born during certain phases of the lunar cycle, especially near the full moon. The paper “The Effect of the Gravitation of the Moon on Frequency of Births” (Environmental Health Insights [2010]: 65–69) classified a random sample of 1007 births at a large hospital in Japan according to lunar phase. In each lunar cycle (27.32 days), the moon moves 360° relative to the earth. To determine lunar phase, the researchers divided the 360° in one lunar cycle into 12 phases of 30°. The sample data are summarized in the accompanying frequency table.
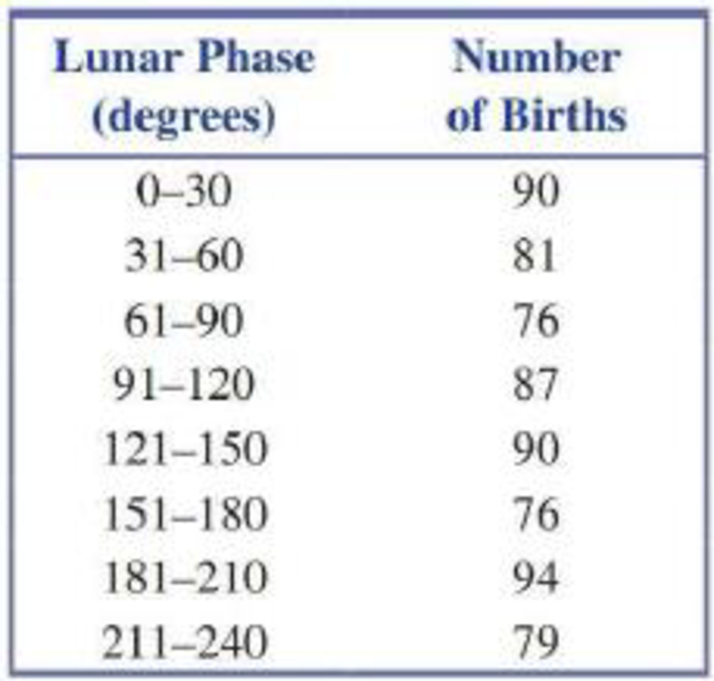
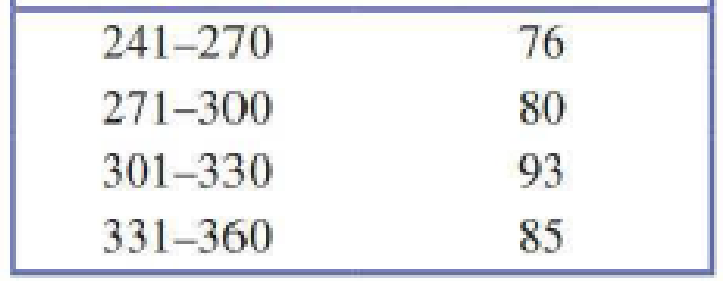
The researchers concluded that the frequency of births is not related to lunar cycle. Carry out a chi-square goodness-of-fit test to determine if the data are consistent with the researchers’ claim. Use a significance level of 0.05 for your test.

Trending nowThis is a popular solution!

Chapter 12 Solutions
Introduction To Statistics And Data Analysis


- The median pH level of the rain in a certain county, was 4.90. A biologist obtains a random sample of 19 rain dates and obtains the following data. Test the hypothesis that the median pH level has decreased from 4.90 at the alpha= 0.05 level of significance.arrow_forwardThe NAEP considers that a national average of 283 is an acceptable performance. Using α = .05, run a two-tail t-test for one sample to test Ho: µ=283 for the 2019 scores. Report the t-obt, df, and p-values. Would you reject the null hypothesis that the 2019 scores come from a population with average 283? If this is the case, does it come from a population from larger or smaller average?arrow_forwardDr. Romanoff reported the following in a journal: “F (5, 106) = 10.09, p = .04.” Should Dr. Romanoff state that there are significant differences among the variable means at a .05 alpha level?arrow_forward
- An electrical engineer wishes to determine if, among two specific municipal buildings in town, Building “North” and Building “South”, whether the tensile strength of pipes (in psi) is not the same in each of these two buildings. A sample of pipes was chosen at random from both Building “North” and Building “South”, respectively. Using α = 0.05, which of the following statistical test, or parameter, would be best for determining whether tensile strength of pipes (in psi) is not the same in each of these two buildings? (Assume all statistical assumptions met.) a) Binomial Distribution b) Population Difference in Means (i.e., Unpaired Data) c) The Chi-Squared Test of Independence d) Population Mean Difference (i.e., Paired Data)arrow_forward1. In the book Design and Analysis of Experiments, 8th edition (2012, John Wiley & Sons), the results of an experiment involving a storage battery used in the launching mechanism of a shoulder-fired ground-to-air missile were presented. Three material types can be used to make the battery plates. The objective is to design a battery that is relatively unaffected by the ambient temperature. The output response from the battery is effective life in hours. Three temperature levels are selected, and a factorial experiment with four replicates is run. The data are as follows: Table 11.(a) Test the appropriate hypotheses and draw conclusions using the analysis ether either firing temperature or furnace position affects the baked density of a carbon anode. The data are as follows: Table 12.(a) State the hypotheses of interest. (b) Test the hypotheses in part (a) using the analysis of variance with a = 0.05. What are your conclusions? (c) Analyze the residuals from this experiment. (d)…arrow_forwardBased on a survey of a random sample of 900 adults in the United States, a journalist reports that A random sample of 100 movie goers was asked to state his or her gender and favorite soft drink available at the local movie theater. The results appear in the table below. Is there a relationship between gender and soft drink preference? Coke Diet Coke Sprite Male 23 11 12 Female 16 28 10 To analyze the results, which of the following tests is most appropriate? A)Chi-square test of independence B)Chi-square test of homogeneity C)Two sample t-test D)Matched pair t-test E)Chi-square goodness of fitarrow_forward
- A sample of n = 25 scores is selected from a population with mu = 80 with sigma ^ 2 = 20 On average, how much error is expected between the sample mean and the population mean?arrow_forwardDo types of crimes reported on television newscasts differ by the age of the criminals? A researcher uses her dvr to record the local television news for a 2-week period of time. She records the types of crimes and notes the age of the offender. Conduct a chi-square test (alpha = .05) of the null hypothesis that televised offense type does not vary by age group of offender. Offense type Young middle age older violent 27 10 3 property 14 12 11 sex 7 9 5 Report the obtained chi-square, df, and critical chi-square. Report your findings based on the null hypothesis.arrow_forwardA researcher interviewed a random sample of 100 library patrons as they were leaving the library and found that 54% of them had checked out books.A) Statistic B) Parameterarrow_forward
- A study was conducted to examine if children with autism spectrum disorder (ASD) had higher prenatal exposure to air pollution, specifically particulate matter < 2.5 g in diameter (PM2.5). Researchers obtained birth records of all children born in Los Angeles between 2000 and 2008 and linked these to the Department of Developmental Services records to determine if any of those subjects had been diagnosed with ASD or not. They used the birth addresses given in the birth records to determine the average daily PM2.5 for the third trimester for each child. The standard deviation for PM2.5 among ASD subjects was found to be 34.6 and for non-ASD subjects was 16.8. Assume PM2.5 is normally distributed. 4a. What was the study design? * Randomized Clinical Trial (RCT) * Case Report * Nested Case-Control Study * Case-Control Study * cross-sectional study Cohort Study 4B. What are the null and alternative hypotheses? 4c. What type of statistical test would you use to analyze the…arrow_forwardUsing all 1991 birth records in the computerized national birth certificate registry compiled by the National Center for Health Statistics (NCHS), statisticians Traci Clemons and Marcello Pagano found that the birth weights of babies in the United States are not symmetric ("Are babies normal?" The American Statistician, Nov 1999, 53:4). However, they also found that when infants born outside of the "typical" 37-43 weeks and infants born to mothers with a history of diabetes are excluded, the birth weights of the remaining infants do follow a Normal model with mean μ = 3432 g and standard deviation σ = 482 g. The following questions refer to infants born from 37 to 43 weeks whose mothers did not have a history of diabetes.arrow_forwardUsing all 1991 birth records in the computerized national birth certificate registry compiled by the National Center for Health Statistics (NCHS), statisticians Traci Clemons and Marcello Pagano found that the birth weights of babies in the United States are not symmetric (\"Are babies normal?\" The American Statistician, Nov 1999, 53:4). However, they also found that when infants born outside of the \"typical\" 37-43 weeks and infants born to mothers with a history of diabetes are excluded, the birth weights of the remaining infants do follow a Normal model with mean μ = 3432 g and standard deviation σ = 482 g. The following questions refer to infants born from 37 to 43 weeks whose mothers did not have a history of diabetes. Compute the z-score of an infant who weighs 3762 g. (Round your answer to at least two decimal places.) Approximately what fraction of infants would you expect to have birth weights between 2890 g and 3410 g? (Express your answer as a decimal, not a percent, and…arrow_forward
 Holt Mcdougal Larson Pre-algebra: Student Edition...AlgebraISBN:9780547587776Author:HOLT MCDOUGALPublisher:HOLT MCDOUGAL