
Videos
The color vision of birds plays a role in their foraging behavior: Birds use color to select and avoid certain types of food. The authors of the article “Colour Avoidance in Northern Bobwhites: Effects of Age, Sex, and Previous Experience” (Animal Behaviour [1995]: 519–526) studied the pecking behavior of 1-day-old bobwhites. In an area painted white, they inserted four pins with different colored heads. The color of the pin chosen on the bird’s first peck was noted for each of 33 bobwhites, resulting in the accompanying table.
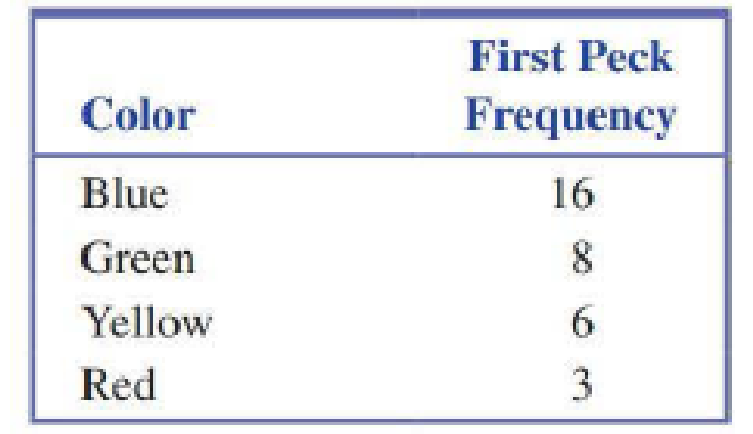
Do the data provide evidence of a color preference? Test using α = 0.01.

Trending nowThis is a popular solution!

Chapter 12 Solutions
Bundle: Introduction to Statistics and Data Analysis, 5th + WebAssign Printed Access Card: Peck/Olsen/Devore. 5th Edition, Single-Term


- One game at a carnival is called “Duck Pond.” This game consists of a large number of ducks that arefloating through an oval-shaped trough. A sign claims that 20% of the ducks have a blue dot on thebottom of them, 20% have a red dot, 20% have a green dot, 20% have a yellow dot, and 20% have anorange dot. Players pay to select one duck, show the color to the game attendant, replace the duck, spinaround once, and then select a second duck. If the dot on the bottom of the second duck matches the dotthat was on the bottom of the first duck, the player wins. Otherwise, the player loses. a) Are the events “color of the first duck” and “color of the second duck” independent? Explain. b) You want to perform a simulation to estimate the probability of winning this game, assuming theduck colors are distributed as claimed. Describe how you could use a table of random digits tocarry out this simulation without needing to skip any digits. c) Perform 10 trials of the simulation described in part (b)…arrow_forwardMany animals, including humans, tend to avoid direct eye contact and even patterns that look like eyes. Some insects, including moths, have evolved eye-spot patterns on their wings to help ward off predators. Scaife (1976) reports a study examining how eye-spot patterns affect the behavior of birds. In the study, the birds were tested in a box with two chambers and were free to move from one chamber to another. In one chamber, two large eye-spots were painted on one wall. The other chamber had plain walls. The researcher recorded the amount of time each bird spent in the plain chamber during a 60-minute session. Suppose the study produced a mean of M=37minutes in the plain chamber with SS=288 for a sample of n=9 birds. (Note: If the eye-spots have no effect, then the birds should spend an average of μ=30 minutes in each chamber.) Is this sample sufficient to conclude that the eye-spots have a significant influence on the birds’ behavior? Use a two-tailed test with a= .05. Compute the…arrow_forwardMany animals, including humans, tend to avoid direct eye contact and even patterns that look like eyes. Some insects, including moths, have evolved eye-spot patterns on their wings to help ward off predators. Scaife (1976) reports a study examining how eye-spot patterns affect the behavior of birds. In the study, the birds were tested in a box with two chambers and were free to move from one chamber to another. In one chamber, two large eye-spots were painted on one wall. The other chamber had plain walls. The researcher recorded the amount of time each bird spent in the plain chamber during a 60-minute session. Suppose the study produced a mean of M=34.5 minutes on the plain chamber with SS=210 for a sample of n=15 birds. (Note: If the eye spots have no effect, then the birds should spend an average of ?=30minutes in each chamber.) a. Is this sample sufficient to conclude that the eye-spots have a significant influence on the birds' behavior? Use a two-tailed test with ?=.05. b.…arrow_forward
- Many animals, including humans, tend to avoid direct eye contact and even patterns that look like eyes. Some insects, including moths, have evolved eye-spot patterns on their wings to help ward off predators. Scaife (1976) reports a study examining how eye-spot patterns affect the behavior of birds. In the study, the birds were tested in a box with two chambers and were free to move from one chamber to another. In one chamber, two large eye-spots were painted on one wall. The other chamber had plain walls. The researcher recorded the amount of time each bird spent in the plain chamber during a 60-minute session. Suppose the study produced a mean of M = 34.5 minutes on the plain chamber with SS = 210 for a sample of n = 15 birds. (Note: If the eye spots have no effect, then the birds should spend an average of μ = 30 minutes in each chamber.) a. Is this sample sufficient to conclude that the eyespots have a significant influence on the birds’ behavior? Use a two-tailed test with α =…arrow_forwardMany animals, including humans, tend to avoid direct eye contact and even patterns that look like eyes. Some insects, including moths, have evolved eye-spot patterns on their wings to help ward off predators. Scaife (1976) reports a study examining how eye-spot patterns affect the behavior of birds. In the study, the birds were tested in a box with two chambers and were free to move from one chamber to another. In one chamber, two large eye-spots were painted on one wall. The other chamber had plain walls. The researcher recorded the amount of time each bird spent in the plain chamber during a 60-minute session. Suppose the study produced a mean of M = 37 minutes in the plain chamber with SS = 288 for a sample of n = 9 birds. (Note: If the eye-spots have no effect, then the birds should spend an average of μ = 30 minutes in each chamber.) Is this sample sufficient to conclude that the eyespots have a significant influence on the birds’ behavior? Use a two-tailed test with α = .05.…arrow_forwardMany animals, including humans, tend to avoid direct eye contact and even patterns that look like eyes. Some insects, including moths, have evolved eye-spot patterns on their wings to help ward off predators. Scalfe (1976) reports a study examining how eye-spot patterns affect the behavior of birds. In the study, the birds were tested in a box with two chambers and were free to move from one chamber to another. In one chamber, two large eye-spots were painted on one wall. The other chamber had plain walls. The researcher recorded the amount of time each bird spent in the plain chamber during a 60-minute session. Suppose the study produced a mean of M = 34.5 minutes in the plain chamber with SS = 210 for a sample of n = 15 birds. (Note: If the eye spots have no effect, then the birds should spend an average of µ = 30 minutes in each chamber. Construct the 90% confidence interval to estimate the mean amount of time spent on the plain side for the population of birds.arrow_forward
- Research indicates that the color red increases men’s attraction to women (Elliot & Niesta, 2008). In the original study, men were shown women’s photographs presented on either a white or a red background. Photographs presented on red were rated significantly more attractive than the same photographs mounted on white. In a similar study, a researcher prepares a set of 30 women’s photographs, with 15 mounted on a white background and 15 mounted on red. One picture is identified as the test photograph and appears twice in the set, once on white and once on red. Each male participant looks through the entire set of photographs and rates the attractiveness of each woman on a 10-point scale. The following table summarizes the ratings of the test photograph for a sample of Are the ratings for the test photograph significantly different when it is presented on a red background compared to a white background? Use a two-tailed test with. Participant White Background Red…arrow_forwardA study by a reputable research group captured multitasking activities of adults who use different devices while watching TV. The study reported that 320 of 442 (72%) smartphone users sampled, 192 of 350 (55%)computer users sampled, and 139 of 260 (53%) tablet users sampled used their device to check social media unrelated to the video content while watching TV. Complete parts (a) through (c) below. a. Is there evidence of a significant difference among the smartphone, computer, and tablet users with respect to the proportion who use their device to check social media unrelated to the video content while watching TV? (Use α=0.10.) The test statistic is χ2STAT= Find X2STAT Please show me the process of how you find this.arrow_forwardHow does visual art affect the perception and evaluation of consumer products? Subiects were asked to evaluate an advertisement for bathroom fittings that contained an art image, a nonart image, or no image. The art image was Vermeer's painting Girl with a Pearl Earring, and the nonart image was a photograph of the actress Scarlett Johansson in the same pose wearing the same garments as the girl in the painting and was taken from the motion picture Girl with a Pearl Earring. Thus the art and nonart images were a match on content. College students were divided at random into three groups of 39 each, with each group assigned to one of the three types of advertisements. Students evaluated the product in the advertisement on a scale of 1 to 7, with 1 being the most unfavorable rating and 7 being the most fa vorable. The paper reported that a one-way ANOVA on the product evaluation index had F = 6.29 with P < 0.05.13 a. identify the populations and the response variable. b. what is the…arrow_forward
- Television sets are given a final inspection following assembly. Three types of defects are identified, critical, major, and minor defects, by a mail-order house. Data are analyzed with the following results. Sets having no 75% defects Sets having only 2% critical defects Sets having only 5% major defects Sets having only 7% minor defects Sets having only 3% critical and major defects Sets having only 4% critical and minor defects Sets having only 3% minor and major defects Sets having all 1% three types of defects What is the probability that a randomly selected set has a critical or major defeca? OA. 0.10 OB. 0.35 OC. 0.25 OD. 0.01 OE. 0.30arrow_forwardA study by a reputable research group captured multitasking activities of adults who use different devices while watching TV. The study reported that 320 of 442 (72%) smartphone users sampled, 192 of 350 (55%) computer users sampled, and 139 of 260 (53%)tablet users sampled used their device to check social media unrelated to the video content while watching TV. Complete parts (a) through (c) below. a. Is there evidence of a significant difference among the smartphone, computer, and tablet users with respect to the proportion who use their device to check social media unrelated to the video content while watching TV? (Use α=0.10.) Your answer is correct. The test statistic is χ2STAT=35.860 The critical value for α=0.10 Please help and explain how to achieve critical valuearrow_forwardA researcher wanted to study the tendency of people’s choices to be influenced by their environment, so she conducted an experiment. The researcher recruited 90 volunteers. She randomly assigned 30 to sit in a room with red walls, 30 to sit in a room with yellow walls, and 30 to sit in a room with orange walls. After sitting in the room for a while doing mundane activities, she offered them all a snack of strawberries, bananas, or oranges. For each individual, she recorded which room the participant was in and which snack they chose. The data are displayed in the table. The researcher would like to know if these data provide convincing evidence that the distribution of snack choice differs for the various room colors in the population of all volunteers like these. Are the conditions for inference met?arrow_forward
 MATLAB: An Introduction with ApplicationsStatisticsISBN:9781119256830Author:Amos GilatPublisher:John Wiley & Sons Inc
 Probability and Statistics for Engineering and th...StatisticsISBN:9781305251809Author:Jay L. DevorePublisher:Cengage Learning
 Statistics for The Behavioral Sciences (MindTap C...StatisticsISBN:9781305504912Author:Frederick J Gravetter, Larry B. WallnauPublisher:Cengage Learning
 Elementary Statistics: Picturing the World (7th E...StatisticsISBN:9780134683416Author:Ron Larson, Betsy FarberPublisher:PEARSON
 The Basic Practice of StatisticsStatisticsISBN:9781319042578Author:David S. Moore, William I. Notz, Michael A. FlignerPublisher:W. H. Freeman
 Introduction to the Practice of StatisticsStatisticsISBN:9781319013387Author:David S. Moore, George P. McCabe, Bruce A. CraigPublisher:W. H. Freeman