
Concept explainers
Videos
The report “Fatality Facts 2004: Bicycles” (Insurance Institute, 2004) included the following table classifying 715 fatal bicycle accidents according to time of day the accident occurred.
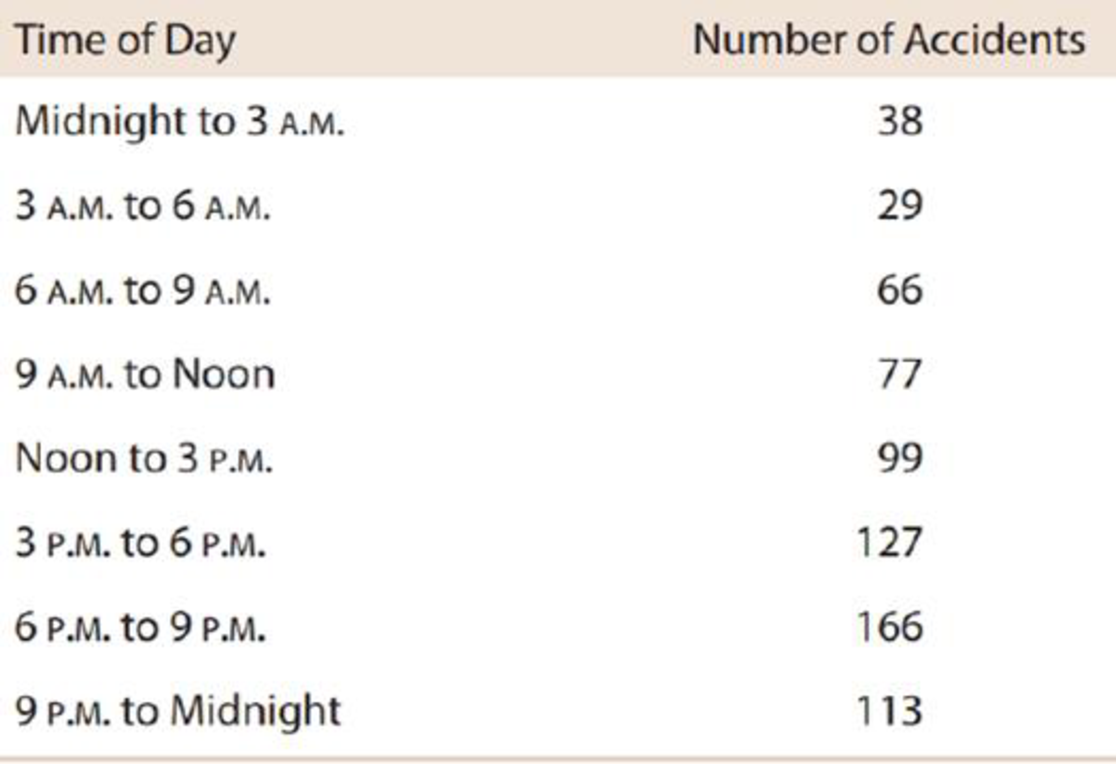
a. Assume it is reasonable to regard the 715 bicycle accidents summarized in the table as a random sample of fatal bicycle accidents. Do these data support the hypothesis that fatal bicycle accidents are not equally likely to occur in each of the 3-hour time periods used to construct the table? Test the relevant hypotheses using a significance level of .05.
b. Suppose a safety office proposes that bicycle fatalities are twice as likely to occur between noon and midnight as during midnight to noon and suggests the following hypothesis: H0: p1 = 1/3, p2 = 2/3, where p1 is the proportion of accidents occurring between midnight and noon and p2 is the proportion occurring between noon and midnight. Do the given data provide evidence against this hypothesis, or are the data consistent with it? Justify your answer with an appropriate test. (Hint: Use the data to construct a one-way table with just two time categories.)

Trending nowThis is a popular solution!

Chapter 12 Solutions
Bundle: Introduction to Statistics and Data Analysis, 5th + WebAssign Printed Access Card: Peck/Olsen/Devore. 5th Edition, Single-Term


 Glencoe Algebra 1, Student Edition, 9780079039897...AlgebraISBN:9780079039897Author:CarterPublisher:McGraw Hill
 College Algebra (MindTap Course List)AlgebraISBN:9781305652231Author:R. David Gustafson, Jeff HughesPublisher:Cengage Learning