
Concept explainers
Videos
a.
Check whether the 95% confidence interval for the slope include zero. If so explain it and if not explain it.
a.
Answer to Problem 48CE
The 95% confidence intervaldoes not contain zero.
Explanation of Solution
Answer will vary.
Here the data set B is taken, in which the midterm exam and final exam score is given.
Regression:
Suppose
Where,
The total sum of squares is denoted as,
The regression sum of squares is denoted as,
The error sum of squares is denoted as,
From the regression the fitted line is denoted as,
The 95% confidence interval for the slope,
Where,
Procedure for 95% confidence interval using EXCEL:
Software Procedure:
Step-by-step software procedure to find 95% confidence interval using EXCEL software is as follows:
- • Open an EXCEL file.
- • In column A and B, the Midterm Exam Score and Final Exam Score data were entered.
- • Click on data > click on Data analysis.
- • Choose Regression > click OK.
- • Select Input Y range asthe column ofFinal Exam Score.
- • Select Input X range asthe column ofMidterm Exam Score.
- • Select the output range.
- • Click OK.
- Regression using EXCEL software is given below:
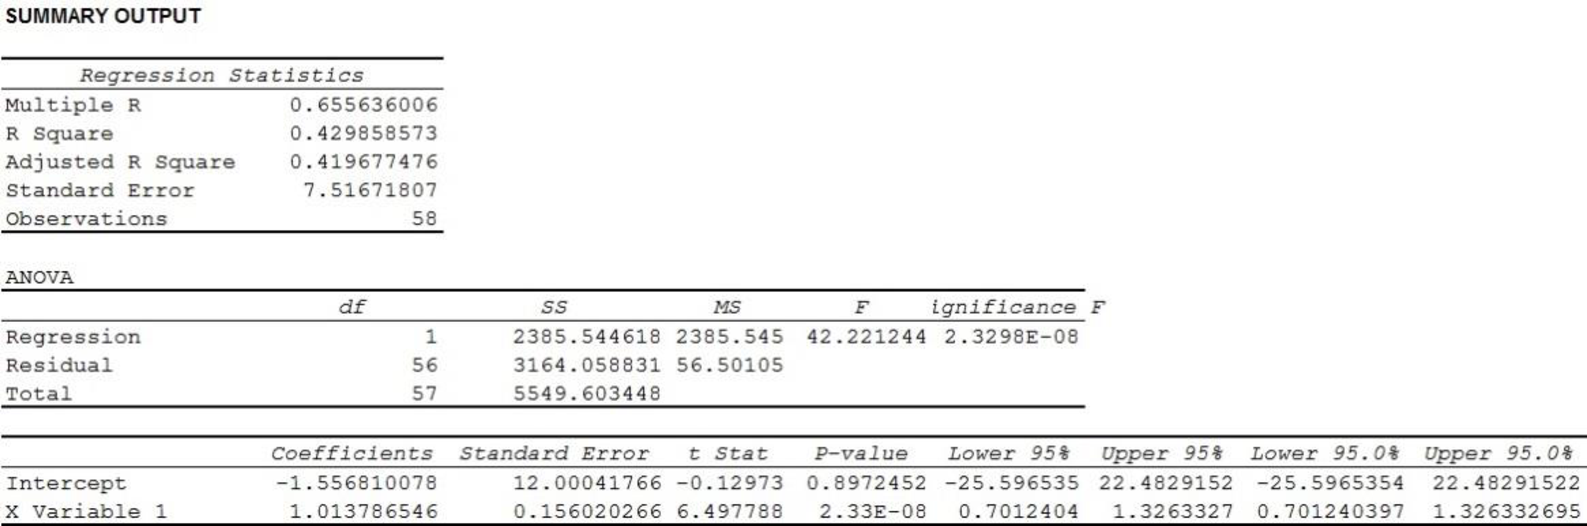
Thus, the 95% confidence interval of the slope is (0.7012, 1.3263).
Interpretation:
From the confidence interval it can be concluded that there is 95% confident that the slope will lie between 0.7012 and 1.3263.
The interval does not contain zero.
Theslope is not zero as the confidence interval does not contain zero.
b.
Perform a two-tailed t test for zero slope at
State the hypotheses, degrees of freedom and critical value for the test.
b.
Answer to Problem 48CE
There is nosufficient evidence to support that the slope is zero.
The hypotheses are:
Null hypothesis:
That is, the slope is zero.
Alternative hypothesis:
That is, the slope not equal to zero.
The degrees of freedom is56.
The critical value is
Explanation of Solution
Calculation:
Hypotheses:
Null hypothesis:
That is, the slope is zero.
Alternative hypothesis:
That is, the slope is not equal to zero.
From part(a), the test statistics is 6.498.
Critical value:
Here, the sample size,
The degrees of freedom is,
Thus, the degrees of freedom is56.
For two tailed test, the critical value for t-test will be,
It is assumed that the level of significance,
Procedure for critical-value using EXCEL:
Software Procedure:
Step-by-step software procedure to obtain critical-value using EXCEL software is as follows:
- • Open an EXCEL file.
- • In cell A1, enter the formula “=T.INV(0.025,56)”
- Output using EXCEL software is given below:
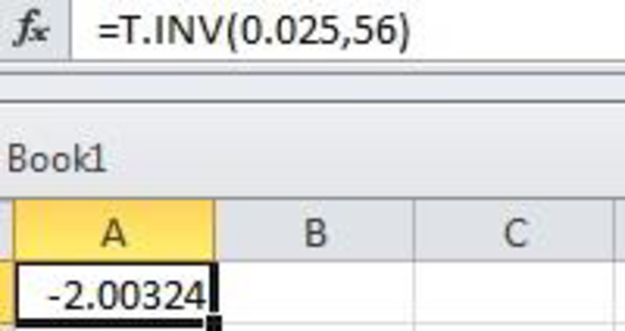
Here, the test is a two tailed test. Hence, the critical value will be
The level of significance is 0.05.
Decision rule:
If
If
Conclusion:
Here the test statistic value is greater than the critical value.
That is,
Hence, by the decision rule, reject the null hypothesis.
That is, the slope differs from zero.
Therefore, it can be concluded that there is nosufficient evidence to support that the slope is zero.
c.
Interpret the p-value for the slope.
c.
Explanation of Solution
From the output in part (a) it is observed that, the p-value for the slope is 0.000. That is, if midterm and final scores are not
d.
Check whether the sample support the hypothesis about the sign of the slope.
d.
Explanation of Solution
From part (b), there is no sufficient evidence to support that the slope is zero. Thus, the slope is either positive or negative. Hence, the sample supports the hypothesis about the sign of the slope.
Want to see more full solutions like this?
Chapter 12 Solutions
Applied Statistics in Business and Economics


 MATLAB: An Introduction with ApplicationsStatisticsISBN:9781119256830Author:Amos GilatPublisher:John Wiley & Sons Inc
 Probability and Statistics for Engineering and th...StatisticsISBN:9781305251809Author:Jay L. DevorePublisher:Cengage Learning
 Statistics for The Behavioral Sciences (MindTap C...StatisticsISBN:9781305504912Author:Frederick J Gravetter, Larry B. WallnauPublisher:Cengage Learning
 Elementary Statistics: Picturing the World (7th E...StatisticsISBN:9780134683416Author:Ron Larson, Betsy FarberPublisher:PEARSON
 The Basic Practice of StatisticsStatisticsISBN:9781319042578Author:David S. Moore, William I. Notz, Michael A. FlignerPublisher:W. H. Freeman
 Introduction to the Practice of StatisticsStatisticsISBN:9781319013387Author:David S. Moore, George P. McCabe, Bruce A. CraigPublisher:W. H. Freeman