
Statistics: The Art and Science of Learning from Data (4th Edition)
4th Edition
ISBN: 9780321997838
Author: Alan Agresti, Christine A. Franklin, Bernhard Klingenberg
Publisher: PEARSON
expand_more
expand_more
format_list_bulleted
Concept explainers
Videos
Textbook Question
Chapter 12, Problem 75CP
World population growth The table shows the world population size (in billions) since 1900.
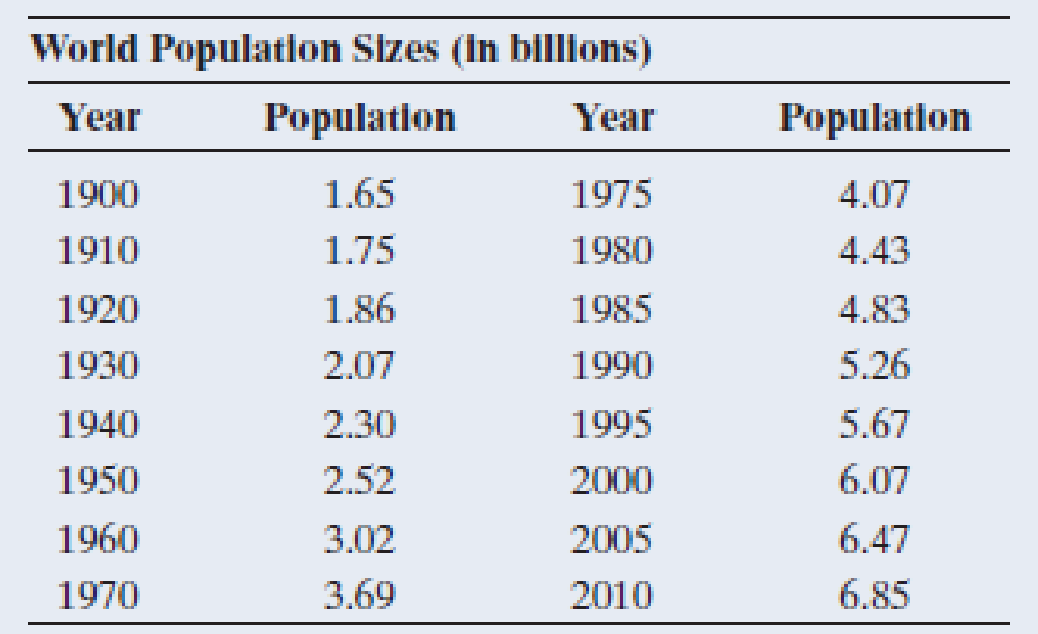
Source: U.S. Bureau of the Census
- a. Let x denote the number of years since 1900. The exponential regression model fitted to y = population size and x gives
- b. Explain why the fit of the model corresponds to a rate of growth of 1.4% per year.
- c. For this model fit, explain why the predicted population size (i) doubles after 50 years and (ii) quadruples after 100 years.
- d. The
correlation equals 0.961 between the population size and the year number, and it equals 0.991 between the log of the population size and the year number. What does this suggest about whether the straight-line regression model or the exponential regression model is more appropriate for these data?
Expert Solution & Answer
Want to see the full answer?
Check out a sample textbook solution
Students have asked these similar questions
Why do we have in general, two lines of regression? Obtain the regression of Y on X and X on Y from the following table and estimate the blood pressure when the age is 45.
Also give the interpretation.
How to write estimated regression equation from coefficient output?
(i) Determine the least square regression equation that can be used to estimate the per capita tax on the per capita debt.
Chapter 12 Solutions
Statistics: The Art and Science of Learning from Data (4th Edition)
Ch. 12.1 - Car mileage and weight The Car Weight and Mileage...Ch. 12.1 - Prob. 2PBCh. 12.1 - Predicting maximum bench strength in males For the...Ch. 12.1 - Prob. 4PBCh. 12.1 - Mu, not y For a population regression equation,...Ch. 12.1 - Prob. 6PBCh. 12.1 - Study time and college GPA Exercise 3.39 in...Ch. 12.1 - Prob. 8PBCh. 12.1 - Cell phone specs Refer to the cell phone data set...Ch. 12.1 - Prob. 10PB
Ch. 12.2 - t-score? A regression analysis is conducted with...Ch. 12.2 - Prob. 12PBCh. 12.2 - Confidence interval for slope Refer to the...Ch. 12.2 - Prob. 14PBCh. 12.2 - Strength through leg press The high school female...Ch. 12.2 - Prob. 16PBCh. 12.2 - More girls are good? Repeat the previous exercise...Ch. 12.2 - CI and two-sided tests correspond Refer to the...Ch. 12.2 - Advertising and sales Each month, the owner of Caf...Ch. 12.2 - Prob. 20PBCh. 12.2 - GPA and skipping classrevisited Refer to the...Ch. 12.2 - Prob. 22PBCh. 12.3 - Dollars and thousands of dollars If a slope is...Ch. 12.3 - Prob. 24PBCh. 12.3 - Sketch scatterplot Sketch a scatterplot,...Ch. 12.3 - Prob. 26PBCh. 12.3 - Body fat For the Male Athlete Strength data file...Ch. 12.3 - Prob. 28PBCh. 12.3 - SAT regression toward mean Refer to the previous...Ch. 12.3 - Prob. 30PBCh. 12.3 - GPA and study time Refer to the association you...Ch. 12.3 - Prob. 32PBCh. 12.3 - Does tutoring help? For a class of 100 students,...Ch. 12.3 - Prob. 34PBCh. 12.3 - Golf regression In the first round of a golf...Ch. 12.3 - Prob. 36PBCh. 12.3 - Food and drink sales The owner of Berthas...Ch. 12.3 - Prob. 38PBCh. 12.3 - Violent crime and single-parent families Use...Ch. 12.4 - Poor predicted strengths The MINITAB output shows...Ch. 12.4 - Prob. 42PBCh. 12.4 - Bench press residuals The figure is a histogram of...Ch. 12.4 - Predicting house prices The House Selling Prices...Ch. 12.4 - Predicting clothes purchases For a random sample...Ch. 12.4 - Prob. 46PBCh. 12.4 - ANOVA table for leg press Exercise 12.15 referred...Ch. 12.4 - Prob. 48PBCh. 12.4 - Variability and F Refer to the previous two...Ch. 12.4 - Understanding an ANOVA table For a random sample...Ch. 12.4 - Predicting cell phone weight Refer to the cell...Ch. 12.4 - Cell phone ANOVA Report the ANOVA table for the...Ch. 12.5 - Savings grow exponentially You invest 100 in a...Ch. 12.5 - Prob. 55PBCh. 12.5 - Prob. 56PBCh. 12.5 - Prob. 57PBCh. 12.5 - Prob. 58PBCh. 12.5 - Prob. 59PBCh. 12.5 - Prob. 60PBCh. 12.5 - Prob. 61PBCh. 12 - Prob. 62CPCh. 12 - Prob. 63CPCh. 12 - Prob. 64CPCh. 12 - Prob. 65CPCh. 12 - Prob. 66CPCh. 12 - Prob. 67CPCh. 12 - Prob. 68CPCh. 12 - Prob. 69CPCh. 12 - Prob. 70CPCh. 12 - Prob. 71CPCh. 12 - Prob. 72CPCh. 12 - Prob. 73CPCh. 12 - Prob. 74CPCh. 12 - World population growth The table shows the world...Ch. 12 - Prob. 76CPCh. 12 - Prob. 77CPCh. 12 - Prob. 78CPCh. 12 - Prob. 79CPCh. 12 - Prob. 81CPCh. 12 - Prob. 82CPCh. 12 - Prob. 83CPCh. 12 - Prob. 84CPCh. 12 - Prob. 85CPCh. 12 - Prob. 86CPCh. 12 - Prob. 87CPCh. 12 - Prob. 88CPCh. 12 - Prob. 89CPCh. 12 - Assumptions What assumptions are needed to use the...Ch. 12 - Assumptions fail? Refer to the previous exercise....Ch. 12 - Lots of standard deviations Explain carefully the...Ch. 12 - Decrease in home values A Freddie Mac quarterly...Ch. 12 - Population growth Exercise 12.57 about U.S....Ch. 12 - Multiple choice: Interpret r One can interpret r =...Ch. 12 - Multiple choice: Correlation invalid The...Ch. 12 - Multiple choice: Slope and correlation The slope...Ch. 12 - Multiple choice: Regress x on y The regression of...Ch. 12 - Multiple choice: Income and height University of...Ch. 12 - True or false The variables y = annual income...Ch. 12 - Prob. 101CPCh. 12 - Why is there regression toward the mean? Refer to...Ch. 12 - Prob. 103CPCh. 12 - Prob. 104CPCh. 12 - Prob. 105CPCh. 12 - Prob. 106CP
Knowledge Booster


Learn more about
Need a deep-dive on the concept behind this application? Look no further. Learn more about this topic, statistics and related others by exploring similar questions and additional content below.Similar questions
- Table 2 shows a recent graduate’s credit card balance each month after graduation. a. Use exponential regression to fit a model to these data. b. If spending continues at this rate, what will the graduate’s credit card debt be one year after graduating?arrow_forwardWhat is regression analysis? Describe the process of performing regression analysis on a graphing utility.arrow_forwardWhat does the y -intercept on the graph of a logistic equation correspond to for a population modeled by that equation?arrow_forward
arrow_back_ios
arrow_forward_ios
Recommended textbooks for you
 Linear Algebra: A Modern IntroductionAlgebraISBN:9781285463247Author:David PoolePublisher:Cengage Learning
Linear Algebra: A Modern Introduction
Algebra
ISBN:9781285463247
Author:David Poole
Publisher:Cengage Learning
Correlation Vs Regression: Difference Between them with definition & Comparison Chart; Author: Key Differences;https://www.youtube.com/watch?v=Ou2QGSJVd0U;License: Standard YouTube License, CC-BY
Correlation and Regression: Concepts with Illustrative examples; Author: LEARN & APPLY : Lean and Six Sigma;https://www.youtube.com/watch?v=xTpHD5WLuoA;License: Standard YouTube License, CC-BY