
Statistics: The Art and Science of Learning from Data (4th Edition)
4th Edition
ISBN: 9780321997838
Author: Alan Agresti, Christine A. Franklin, Bernhard Klingenberg
Publisher: PEARSON
expand_more
expand_more
format_list_bulleted
Concept explainers
Videos
Textbook Question
Chapter 12.4, Problem 47PB
ANOVA table for leg press Exercise 12.15 referred to an analysis of leg strength for 57 female athletes, with y = maximum leg press and x = number of 200-pound leg presses until fatigue, for which
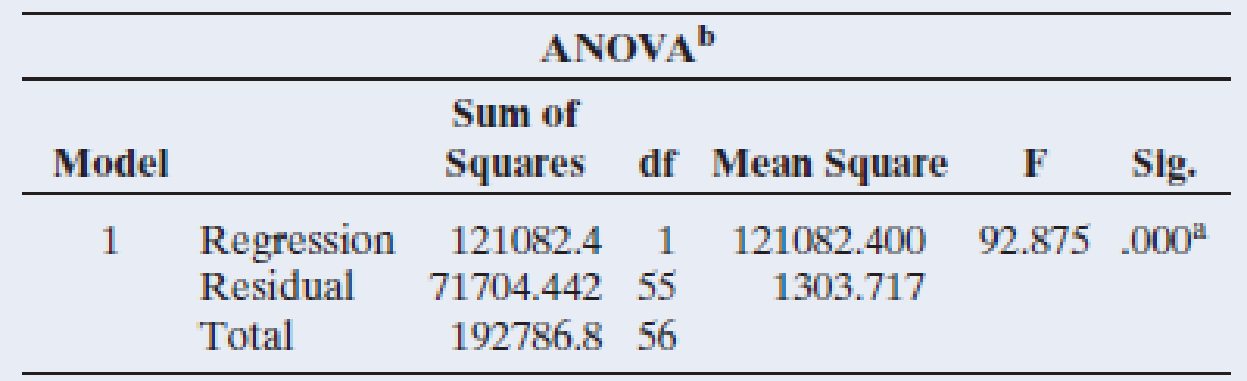
- a. Show that the residual standard deviation is 36.1. Interpret it.
- b. For this sample, x̄ = 22.2. For female athletes with x = 22, what would you estimate the variability to be of their maximum leg press values? If the y values are approximately normal, find an interval within which about 95% of them would fall.
Expert Solution & Answer
Want to see the full answer?
Check out a sample textbook solution
Students have asked these similar questions
I have an 1800 square foot home and based on median price of 628,408, mean listing price $401,398, standard deviation $168,408 and median sq foot of 2108, mean sq foot 2295 and standard deviation sq foot 1128, how do I calculate the regression equation to come up with a listing price for and 1800 sqft home?
The mean travel time from one stop to the next on the Coast Starlight Amtrak is 129 minutes, with a standard deviation of 113 minutes. The mean distance travelled from one stop to the next is 108 miles with standard deviation of 99 miles. The correlation between travel time and distance is 0.636.
a). Find the equation of the regression line for predicting travel time.
So I generated this table with stat program, which is from a regression of temperature (in °C) on atmospheric concentrationof carbon dioxide (CO2), in ppm.
Can you please construct a 95% confidence interval for the slope of the regression equation?
Also, what are the chances of seeing a linear relationship at least as strong as observed from these data, when in fact there was none in the population?
What would be the conclusion from this regression?
Chapter 12 Solutions
Statistics: The Art and Science of Learning from Data (4th Edition)
Ch. 12.1 - Car mileage and weight The Car Weight and Mileage...Ch. 12.1 - Prob. 2PBCh. 12.1 - Predicting maximum bench strength in males For the...Ch. 12.1 - Prob. 4PBCh. 12.1 - Mu, not y For a population regression equation,...Ch. 12.1 - Prob. 6PBCh. 12.1 - Study time and college GPA Exercise 3.39 in...Ch. 12.1 - Prob. 8PBCh. 12.1 - Cell phone specs Refer to the cell phone data set...Ch. 12.1 - Prob. 10PB
Ch. 12.2 - t-score? A regression analysis is conducted with...Ch. 12.2 - Prob. 12PBCh. 12.2 - Confidence interval for slope Refer to the...Ch. 12.2 - Prob. 14PBCh. 12.2 - Strength through leg press The high school female...Ch. 12.2 - Prob. 16PBCh. 12.2 - More girls are good? Repeat the previous exercise...Ch. 12.2 - CI and two-sided tests correspond Refer to the...Ch. 12.2 - Advertising and sales Each month, the owner of Caf...Ch. 12.2 - Prob. 20PBCh. 12.2 - GPA and skipping classrevisited Refer to the...Ch. 12.2 - Prob. 22PBCh. 12.3 - Dollars and thousands of dollars If a slope is...Ch. 12.3 - Prob. 24PBCh. 12.3 - Sketch scatterplot Sketch a scatterplot,...Ch. 12.3 - Prob. 26PBCh. 12.3 - Body fat For the Male Athlete Strength data file...Ch. 12.3 - Prob. 28PBCh. 12.3 - SAT regression toward mean Refer to the previous...Ch. 12.3 - Prob. 30PBCh. 12.3 - GPA and study time Refer to the association you...Ch. 12.3 - Prob. 32PBCh. 12.3 - Does tutoring help? For a class of 100 students,...Ch. 12.3 - Prob. 34PBCh. 12.3 - Golf regression In the first round of a golf...Ch. 12.3 - Prob. 36PBCh. 12.3 - Food and drink sales The owner of Berthas...Ch. 12.3 - Prob. 38PBCh. 12.3 - Violent crime and single-parent families Use...Ch. 12.4 - Poor predicted strengths The MINITAB output shows...Ch. 12.4 - Prob. 42PBCh. 12.4 - Bench press residuals The figure is a histogram of...Ch. 12.4 - Predicting house prices The House Selling Prices...Ch. 12.4 - Predicting clothes purchases For a random sample...Ch. 12.4 - Prob. 46PBCh. 12.4 - ANOVA table for leg press Exercise 12.15 referred...Ch. 12.4 - Prob. 48PBCh. 12.4 - Variability and F Refer to the previous two...Ch. 12.4 - Understanding an ANOVA table For a random sample...Ch. 12.4 - Predicting cell phone weight Refer to the cell...Ch. 12.4 - Cell phone ANOVA Report the ANOVA table for the...Ch. 12.5 - Savings grow exponentially You invest 100 in a...Ch. 12.5 - Prob. 55PBCh. 12.5 - Prob. 56PBCh. 12.5 - Prob. 57PBCh. 12.5 - Prob. 58PBCh. 12.5 - Prob. 59PBCh. 12.5 - Prob. 60PBCh. 12.5 - Prob. 61PBCh. 12 - Prob. 62CPCh. 12 - Prob. 63CPCh. 12 - Prob. 64CPCh. 12 - Prob. 65CPCh. 12 - Prob. 66CPCh. 12 - Prob. 67CPCh. 12 - Prob. 68CPCh. 12 - Prob. 69CPCh. 12 - Prob. 70CPCh. 12 - Prob. 71CPCh. 12 - Prob. 72CPCh. 12 - Prob. 73CPCh. 12 - Prob. 74CPCh. 12 - World population growth The table shows the world...Ch. 12 - Prob. 76CPCh. 12 - Prob. 77CPCh. 12 - Prob. 78CPCh. 12 - Prob. 79CPCh. 12 - Prob. 81CPCh. 12 - Prob. 82CPCh. 12 - Prob. 83CPCh. 12 - Prob. 84CPCh. 12 - Prob. 85CPCh. 12 - Prob. 86CPCh. 12 - Prob. 87CPCh. 12 - Prob. 88CPCh. 12 - Prob. 89CPCh. 12 - Assumptions What assumptions are needed to use the...Ch. 12 - Assumptions fail? Refer to the previous exercise....Ch. 12 - Lots of standard deviations Explain carefully the...Ch. 12 - Decrease in home values A Freddie Mac quarterly...Ch. 12 - Population growth Exercise 12.57 about U.S....Ch. 12 - Multiple choice: Interpret r One can interpret r =...Ch. 12 - Multiple choice: Correlation invalid The...Ch. 12 - Multiple choice: Slope and correlation The slope...Ch. 12 - Multiple choice: Regress x on y The regression of...Ch. 12 - Multiple choice: Income and height University of...Ch. 12 - True or false The variables y = annual income...Ch. 12 - Prob. 101CPCh. 12 - Why is there regression toward the mean? Refer to...Ch. 12 - Prob. 103CPCh. 12 - Prob. 104CPCh. 12 - Prob. 105CPCh. 12 - Prob. 106CP
Knowledge Booster


Learn more about
Need a deep-dive on the concept behind this application? Look no further. Learn more about this topic, statistics and related others by exploring similar questions and additional content below.Similar questions
- It is known that the slope coefficient for regression line Y on X is 0.942 The standard deviation of X and Y are 5 and 9 respectively. Find the value of the correlation coefficient for using given information.arrow_forwardA random sample of 36 patients with arthritis took the drug for three months. Blood tests showed that x=8.8 with sample standard deviation a=3.3. Use a 5% level of significance to test the claim that the drug has changed the mean pH level of the blood.arrow_forwardA hypertensive patient has been on antihypertensive medication for several years. Her physician wants to monitor herblood pressure via weekly measurements taken at home.Each week for 6 weeks she takes several blood pressurereadings and averages the readings to get a summary bloodpressure for the week. The diastolic blood pressure (DBP)results are shown in Table 6.15 are the same as the measured mean and standard deviationover the 6 weeks while the patient is on antihypertensivemedication.)Suppose we have a population with a normal distributionwith mean = 50 and standard deviation = 10.We draw a sample of 13 observations from this distribution.6.106 What is the probability that the sample mean will bewithin 1 unit of the population mean?6.107 Suppose we want to choose a large enough sampleso that the sample mean is within 1 unit of the populationmean 99% of the time. What is the minimum sample size toachieve this goal?arrow_forward
- The patient recovery time from a particular surgical procedure is normallu distrubuted with a mean of 5.3 and a standard deviation of 2.1 days. what is the median recovery time? what is the z-score for a patient who takes ten days to recover?arrow_forwardA particular brand of tires claims that its deluxe tire averages at least 50,000 miles before it needs to be replaced. From past studies of this tire, the standard deviation is known to be 8,000. A survey of owners of that tire design is conducted. From the 28 tires surveyed, the mean lifespan was 46,200 miles with a standard deviation of 9,800 miles. Using alpha = 0.05, is the data highly inconsistent with the claim? state the distribution (round answers to two decimals.) x̅~______(______,______) what is the p-value? (round your answer four decimal points)arrow_forwardAnalysis of annualized returns over a 10-year period showed that prepaid tuition plans had a mean return of 6.3 percent with a standard deviation of 2.7 percent, while the Standard & Poor’s 500 stock index had a mean return of 12.9 percent with a standard deviation of 15.8 percent. (a) Calculate the coefficients of variation of prepaid tuition plans and Standard & Poor’s stock index. (Round your answers to 2 decimal places.)arrow_forward
- The waiting time (in minutes) was measured for a random sample of patients with non-life threatening injuries in emergency rooms at four local hospitals who arrived between 2:00 and 3:00pm on a particular Saturday. The results of the ANOVA and the plot of the residuals follow:Using the information in the outputs, is there evidence that the distribution of observations is normal in each hospital's population?arrow_forwardThe weight of chocolate bars from a particular chocolate factory has a mean of 8 ounces with standard deviation of 0.1 ounce. What is the z-score corresponding to a weight of 8.17 ounces?arrow_forwardAdult men have heights with a mean of 69.0 inches and a standard deviation of 2.8 inches. Find the z-score of man who is 72.2 inches tall. (to 4 decimal places)arrow_forward
- The shelf life of a battery produced by one major company is known to be Normally distributed, with a mean life of 3.5 years and a standard deviation of 0.75 years. What is the upper quartile of battery shelf life? Use the fact that the middle 50% of the data falls within 0.67 standard deviations from the mean.arrow_forwardThe mean value of annual imports for a country is normally distributed with mean of $30 million and standard deviation of $16 million. What dollar value of imports is exceeded only 5% of the time?arrow_forwardThe amount of coffee dispensed by a coffee dispensing machine is normally distributed with mean of 190 mL and a standard deviation of 10 mL. What percentage of the coffee dispensed over 175 ml?arrow_forward
arrow_back_ios
SEE MORE QUESTIONS
arrow_forward_ios
Recommended textbooks for you
 MATLAB: An Introduction with ApplicationsStatisticsISBN:9781119256830Author:Amos GilatPublisher:John Wiley & Sons Inc
 Probability and Statistics for Engineering and th...StatisticsISBN:9781305251809Author:Jay L. DevorePublisher:Cengage Learning
 Statistics for The Behavioral Sciences (MindTap C...StatisticsISBN:9781305504912Author:Frederick J Gravetter, Larry B. WallnauPublisher:Cengage Learning
 Elementary Statistics: Picturing the World (7th E...StatisticsISBN:9780134683416Author:Ron Larson, Betsy FarberPublisher:PEARSON
 The Basic Practice of StatisticsStatisticsISBN:9781319042578Author:David S. Moore, William I. Notz, Michael A. FlignerPublisher:W. H. Freeman
 Introduction to the Practice of StatisticsStatisticsISBN:9781319013387Author:David S. Moore, George P. McCabe, Bruce A. CraigPublisher:W. H. Freeman
MATLAB: An Introduction with Applications
Statistics
ISBN:9781119256830
Author:Amos Gilat
Publisher:John Wiley & Sons Inc
Probability and Statistics for Engineering and th...
Statistics
ISBN:9781305251809
Author:Jay L. Devore
Publisher:Cengage Learning
Statistics for The Behavioral Sciences (MindTap C...
Statistics
ISBN:9781305504912
Author:Frederick J Gravetter, Larry B. Wallnau
Publisher:Cengage Learning
Elementary Statistics: Picturing the World (7th E...
Statistics
ISBN:9780134683416
Author:Ron Larson, Betsy Farber
Publisher:PEARSON
The Basic Practice of Statistics
Statistics
ISBN:9781319042578
Author:David S. Moore, William I. Notz, Michael A. Fligner
Publisher:W. H. Freeman
Introduction to the Practice of Statistics
Statistics
ISBN:9781319013387
Author:David S. Moore, George P. McCabe, Bruce A. Craig
Publisher:W. H. Freeman
Correlation Vs Regression: Difference Between them with definition & Comparison Chart; Author: Key Differences;https://www.youtube.com/watch?v=Ou2QGSJVd0U;License: Standard YouTube License, CC-BY
Correlation and Regression: Concepts with Illustrative examples; Author: LEARN & APPLY : Lean and Six Sigma;https://www.youtube.com/watch?v=xTpHD5WLuoA;License: Standard YouTube License, CC-BY