
Statistics: The Art and Science of Learning from Data (4th Edition)
4th Edition
ISBN: 9780321997838
Author: Alan Agresti, Christine A. Franklin, Bernhard Klingenberg
Publisher: PEARSON
expand_more
expand_more
format_list_bulleted
Concept explainers
Videos
Textbook Question
Chapter 12.4, Problem 45PB
Predicting clothes purchases For a random sample of children from a school district in South Carolina, a
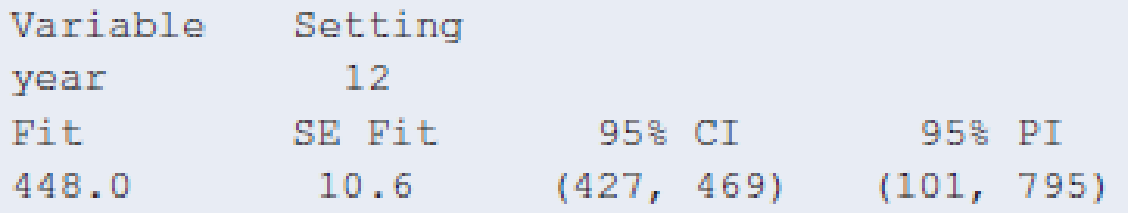
- a. Interpret the value listed under “Fit.”
- b. Interpret the interval listed under “95% CI.”
- c. Interpret the interval listed under “95% PI.”
Expert Solution & Answer
Want to see the full answer?
Check out a sample textbook solution
Students have asked these similar questions
Run a regression analysis on the following data set, where yy is the final grade in a math class and xx is the average number of hours the student spent working on math each week.
hours/weekx
Gradey
4
51.6
5
43
13
82.2
14
90.6
15
89
16
80.4
16
89.4
18
97.2
19
91.6
19
97.6
State the regression equation with constants accurate to 2 decimal places.ˆyy^ = x + What is the predicted value for the final grade when a student spends an average of 11 hours each week on math? Round to 2 decimal places.
Run a regression analysis on the following data set, where yy is the final grade in a math class and xx is the average number of hours the student spent working on math each week.
hours/weekx
Gradey
5
49
6
49.4
8
54.2
11
77.4
13
82.2
14
88.6
14
86.6
15
95
15
94
17
86.8
State the regression equation y=m⋅x+by=m⋅x+b, with constants accurate to two decimal places. What is the predicted value for the final grade when a student spends an average of 13 hours each week on math?Grade = Round to 1 decimal place.
Run a regression analysis on the following data set, where y is the final grade in a math class and x is the average number of hours the student spent working on math each week.
hours/week (x) Grade (y)
7 66.8
7 56.8
8 69.2
11 67.4
13 77.2
14 86.6
17 86.8
17 84.8
18 98.2
20 100
State the regression equation y=m⋅x+b, with constants accurate to two decimal places?
What is the predicted value for the final grade when a student spends an average of 12 hours each week on math? (Round to 1 decimal place)
Grade =
Chapter 12 Solutions
Statistics: The Art and Science of Learning from Data (4th Edition)
Ch. 12.1 - Car mileage and weight The Car Weight and Mileage...Ch. 12.1 - Prob. 2PBCh. 12.1 - Predicting maximum bench strength in males For the...Ch. 12.1 - Prob. 4PBCh. 12.1 - Mu, not y For a population regression equation,...Ch. 12.1 - Prob. 6PBCh. 12.1 - Study time and college GPA Exercise 3.39 in...Ch. 12.1 - Prob. 8PBCh. 12.1 - Cell phone specs Refer to the cell phone data set...Ch. 12.1 - Prob. 10PB
Ch. 12.2 - t-score? A regression analysis is conducted with...Ch. 12.2 - Prob. 12PBCh. 12.2 - Confidence interval for slope Refer to the...Ch. 12.2 - Prob. 14PBCh. 12.2 - Strength through leg press The high school female...Ch. 12.2 - Prob. 16PBCh. 12.2 - More girls are good? Repeat the previous exercise...Ch. 12.2 - CI and two-sided tests correspond Refer to the...Ch. 12.2 - Advertising and sales Each month, the owner of Caf...Ch. 12.2 - Prob. 20PBCh. 12.2 - GPA and skipping classrevisited Refer to the...Ch. 12.2 - Prob. 22PBCh. 12.3 - Dollars and thousands of dollars If a slope is...Ch. 12.3 - Prob. 24PBCh. 12.3 - Sketch scatterplot Sketch a scatterplot,...Ch. 12.3 - Prob. 26PBCh. 12.3 - Body fat For the Male Athlete Strength data file...Ch. 12.3 - Prob. 28PBCh. 12.3 - SAT regression toward mean Refer to the previous...Ch. 12.3 - Prob. 30PBCh. 12.3 - GPA and study time Refer to the association you...Ch. 12.3 - Prob. 32PBCh. 12.3 - Does tutoring help? For a class of 100 students,...Ch. 12.3 - Prob. 34PBCh. 12.3 - Golf regression In the first round of a golf...Ch. 12.3 - Prob. 36PBCh. 12.3 - Food and drink sales The owner of Berthas...Ch. 12.3 - Prob. 38PBCh. 12.3 - Violent crime and single-parent families Use...Ch. 12.4 - Poor predicted strengths The MINITAB output shows...Ch. 12.4 - Prob. 42PBCh. 12.4 - Bench press residuals The figure is a histogram of...Ch. 12.4 - Predicting house prices The House Selling Prices...Ch. 12.4 - Predicting clothes purchases For a random sample...Ch. 12.4 - Prob. 46PBCh. 12.4 - ANOVA table for leg press Exercise 12.15 referred...Ch. 12.4 - Prob. 48PBCh. 12.4 - Variability and F Refer to the previous two...Ch. 12.4 - Understanding an ANOVA table For a random sample...Ch. 12.4 - Predicting cell phone weight Refer to the cell...Ch. 12.4 - Cell phone ANOVA Report the ANOVA table for the...Ch. 12.5 - Savings grow exponentially You invest 100 in a...Ch. 12.5 - Prob. 55PBCh. 12.5 - Prob. 56PBCh. 12.5 - Prob. 57PBCh. 12.5 - Prob. 58PBCh. 12.5 - Prob. 59PBCh. 12.5 - Prob. 60PBCh. 12.5 - Prob. 61PBCh. 12 - Prob. 62CPCh. 12 - Prob. 63CPCh. 12 - Prob. 64CPCh. 12 - Prob. 65CPCh. 12 - Prob. 66CPCh. 12 - Prob. 67CPCh. 12 - Prob. 68CPCh. 12 - Prob. 69CPCh. 12 - Prob. 70CPCh. 12 - Prob. 71CPCh. 12 - Prob. 72CPCh. 12 - Prob. 73CPCh. 12 - Prob. 74CPCh. 12 - World population growth The table shows the world...Ch. 12 - Prob. 76CPCh. 12 - Prob. 77CPCh. 12 - Prob. 78CPCh. 12 - Prob. 79CPCh. 12 - Prob. 81CPCh. 12 - Prob. 82CPCh. 12 - Prob. 83CPCh. 12 - Prob. 84CPCh. 12 - Prob. 85CPCh. 12 - Prob. 86CPCh. 12 - Prob. 87CPCh. 12 - Prob. 88CPCh. 12 - Prob. 89CPCh. 12 - Assumptions What assumptions are needed to use the...Ch. 12 - Assumptions fail? Refer to the previous exercise....Ch. 12 - Lots of standard deviations Explain carefully the...Ch. 12 - Decrease in home values A Freddie Mac quarterly...Ch. 12 - Population growth Exercise 12.57 about U.S....Ch. 12 - Multiple choice: Interpret r One can interpret r =...Ch. 12 - Multiple choice: Correlation invalid The...Ch. 12 - Multiple choice: Slope and correlation The slope...Ch. 12 - Multiple choice: Regress x on y The regression of...Ch. 12 - Multiple choice: Income and height University of...Ch. 12 - True or false The variables y = annual income...Ch. 12 - Prob. 101CPCh. 12 - Why is there regression toward the mean? Refer to...Ch. 12 - Prob. 103CPCh. 12 - Prob. 104CPCh. 12 - Prob. 105CPCh. 12 - Prob. 106CP
Knowledge Booster


Learn more about
Need a deep-dive on the concept behind this application? Look no further. Learn more about this topic, statistics and related others by exploring similar questions and additional content below.Similar questions
- Table 6 shows the population, in thousands, of harbor seals in the Wadden Sea over the years 1997 to 2012. a. Let x represent time in years starting with x=0 for the year 1997. Let y represent the number of seals in thousands. Use logistic regression to fit a model to these data. b. Use the model to predict the seal population for the year 2020. c. To the nearest whole number, what is the limiting value of this model?arrow_forwardThe following fictitious table shows kryptonite price, in dollar per gram, t years after 2006. t= Years since 2006 0 1 2 3 4 5 6 7 8 9 10 K= Price 56 51 50 55 58 52 45 43 44 48 51 Make a quartic model of these data. Round the regression parameters to two decimal places.arrow_forwardUse the table of values you made in part 4 of the example to find the limiting value of the average rate of change in velocity.arrow_forward
- Find the equation of the regression line for the following data set. x 1 2 3 y 0 3 4arrow_forwardA regression of average monthly expenditure (AME, measured in euros) on average monthly income (AMI, measured in euros) using a random sample of college-educated full-time workers earnings €100 to €1.5 million yields the following: AME = 710.7 + 8.8 × AMI, R2 = 0.030, SER = 540.30 d. What does the regression predict will be the expenditure of a person with an income of €100? With an income of €200? e. Will the regression give reliable predictions for a person with an income of €2 million? Why or why not? ( f. Given what you know about the distribution of earnings, do you think it is plausible that the distribution of errors in the regression is normal? (Hint: Do you think that the distribution is symmetric or skewed? What is the smallest value of earnings, and is it consistent with a normal distribution?).arrow_forwardRun a regression analysis on the following data set, where y is the final grade in a math class and x is the average number of hours the student spent working on math each week. hours/weekx Gradey 5 56 8 55.2 10 65 11 73.4 12 74.8 15 87 15 93 16 88.4 16 88.4 19 96.6 State the regression equation with constants accurate to 2 decimal places.y^ = x += What is the predicted value for the final grade when a student spends an average of 6 hours each week on math? Round to 2 decimal places.arrow_forward
- A sociologist is interested in the relation between ?, the number of job changes and ?, the annual salary (in thousands of dollars) for people living in the Nashville area. A random sample of 10 people employed in Nashville provided the following information: X 4 7 5 6 1 5 9 10 10 3 Y 33 37 34 32 32 38 43 37 40 33 A-C Answered! d) What does the slope of the regression equation represent in terms of the annual salary? e) Identify any outliers or potential influential observations. Explain your reasoning. f) Identify the predictor and response variables g)r^2=_____ h)r=_____ i) Interpret the meaning of r2 and how useful the regression equation is for making predictions. j) Interpret the meaning of r in terms of the linear relationship between the number of job changes and annual salary. k) Use the regression equation to predict the annual salary of a randomly selected employee who has had 8 job changes. l) A particular employee who has had 8 job changes has an annual salary…arrow_forwardRun a regression analysis on the following data set, where yy is the final grade in a math class and xx is the average number of hours the student spent working on math each week. hours/weekx Gradey 5 56 9 67.6 10 72 11 75.4 12 66.8 13 89.2 13 71.2 14 86.6 14 83.6 14 88.6 State the regression equation y=m⋅x+by=m⋅x+b, with constants accurate to two decimal places.What is the predicted value for the final grade when a student spends an average of 15 hours each week on math?Grade = Round to 1 decimal place.arrow_forwardConsider the following regression equation representing the linear relationship between the Canada Child Benefit provided for a married couple with 3 children under the age of 6, based on their annual family net income: ŷ =121.09−0.57246xR2=0.894 where y = annual Canada Child Benefit paid (in $100s) x = net annual family income (in $1000s) Source: Canada Revenue Agency a. As the net annual family income increases, does the Canada Child Benefit paid increase or decrease? Based on this, is the correlation between the two variables positive or negative?The Canada Child Benefit paid .The correlation between the two variables is .b. Calculate the correlation coefficient and determine if the relationship between the two variables is strong, moderate or weak.r= , the relationship is . Round to 3 decimal places c. Interpret the value of the slope as it relates to this relationship. For every $1 increase in annual family net income, there is a $0.57246 decrease in…arrow_forward
- Consider the following regression equation representing the linear relationship between the Canada Child Benefit provided for a married couple with 3 children under the age of 6, based on their annual family net income: ŷ =121.09−0.57246xR2=0.894 where y= annual Canada Child Benefit paid (in $100s) x = net annual family income (in $1000s) Source: Canada Revenue Agency a. As the net annual family income increases, does the Canada Child Benefit paid increase or decrease? Based on this, is the correlation between the two variables positive or negative?The Canada Child Benefit paid ? .The correlation between the two variables is ? .b. Calculate the correlation coefficient and determine if the relationship between the two variables is strong, moderate or weak.r= , the relationship is ? . Round to 3 decimal places c. Interpret the value of the slope as it relates to this relationship. For every $1 increase in annual family net income, there is a $0.57246 decrease in…arrow_forwardA regression model to predict Y, the state burglary rate per 100,000 people for 2005, used the following four state predictors: X1 = median age in 2005, X2 = number of 2005 bankruptcies, X3 = 2004 federal expenditures per capita (a leading predictor), and X4 = 2005 high school graduation percentage. (a) Fill in the values in the table given here for a two-tailed test at α = 0.01 with 33 d.f. (Negative values should be indicated by a minus sign. Leave no cells blank - be certain to enter "0" wherever required. Round your t-values to 3 decimal places and p-values to 4 decimal places.) Predictor Coefficient SE tcalc p-value Intercept 4,579.5465 791.5050 AgeMed -27.292 12.1893 Bankrupt 19.5612 12.0754 FedSpend -0.0132 0.0116 HSGrad% -27.5839 7.1731 (b-1) What is the critical value of Student's t in Appendix D for a two-tailed test at α = .01 with 33 d.f? (Round your answer to 3 decimal places.) t-value = (b-2) Choose the correct option.…arrow_forwardA professor obtains SAT scores and freshman grade point averages (GPA) for a group of n=15 college students. The SAT scores have a mean of M=580 with SS=22,400, and GPA has a mean of 3.10 with SS=1.26, and SP=84.c. Does the regression equation account for a significant portion of the variance in GPA? Use ?=.05α=.05 to evaluate the F-ratio.arrow_forward
arrow_back_ios
SEE MORE QUESTIONS
arrow_forward_ios
Recommended textbooks for you
 Functions and Change: A Modeling Approach to Coll...AlgebraISBN:9781337111348Author:Bruce Crauder, Benny Evans, Alan NoellPublisher:Cengage Learning
 Algebra & Trigonometry with Analytic GeometryAlgebraISBN:9781133382119Author:SwokowskiPublisher:Cengage
 Trigonometry (MindTap Course List)TrigonometryISBN:9781337278461Author:Ron LarsonPublisher:Cengage Learning

Functions and Change: A Modeling Approach to Coll...
Algebra
ISBN:9781337111348
Author:Bruce Crauder, Benny Evans, Alan Noell
Publisher:Cengage Learning
Algebra & Trigonometry with Analytic Geometry
Algebra
ISBN:9781133382119
Author:Swokowski
Publisher:Cengage
Trigonometry (MindTap Course List)
Trigonometry
ISBN:9781337278461
Author:Ron Larson
Publisher:Cengage Learning
Correlation Vs Regression: Difference Between them with definition & Comparison Chart; Author: Key Differences;https://www.youtube.com/watch?v=Ou2QGSJVd0U;License: Standard YouTube License, CC-BY
Correlation and Regression: Concepts with Illustrative examples; Author: LEARN & APPLY : Lean and Six Sigma;https://www.youtube.com/watch?v=xTpHD5WLuoA;License: Standard YouTube License, CC-BY