
EBK MATHEMATICS FOR THE TRADES
11th Edition
ISBN: 8220106960455
Author: CARMAN
Publisher: PEARSON
expand_more
expand_more
format_list_bulleted
Videos
Textbook Question
Chapter 12.1, Problem 10BE
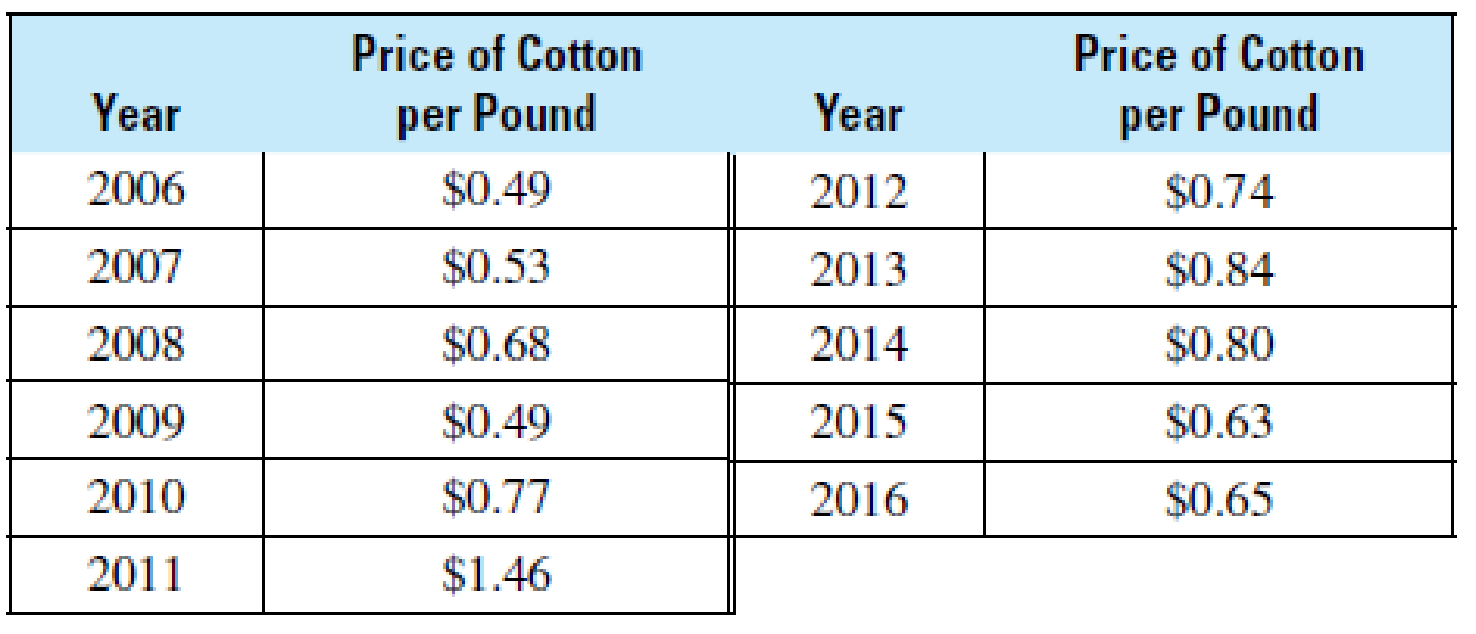
Agriculture The following table shows the price per pound of cotton on the New York Board of Trade in mid-June from 2006–2016. Construct a broken-line graph illustrating the fluctuation in these prices over the time period indicated.
Expert Solution & Answer
Want to see the full answer?
Check out a sample textbook solution
Students have asked these similar questions
Does this graph have trends and/or seasonality?
What forecasting method is suitable for this data?
draw a line graph following this information. The line graph depicts the historical and projected sales volume of Pepsi Co Jamaica's Diet Pepsi for the next fiscal year, with the horizontal axis representing the four quarters of the year, and the vertical axis representing the sales volume in million cases. The historical sales data is represented by a line that shows a sales volume of 1 million cases for the past fiscal year. The projected sales volume is represented by another line that shows an expected increase in sales volume to 1.5 million cases for the next fiscal year. The sales targets for each quarter are represented by markers or points on the graph, with the first quarter expected to reach 0.4 million cases, the second quarter at 0.5 million cases, the third quarter at 0.3 million cases, and the fourth quarter at 0.3 million cases.
The graph below plots changes murders by firearms over time, focusing on the effects of a "Stand Your Ground" law, which made it legal for someone to use deadly force if they felt they were defending themselves "reasonably." How might this graph confuse people over the possible effects of the law?
Chapter 12 Solutions
EBK MATHEMATICS FOR THE TRADES
Ch. 12.1 - Solve: 0.82=x100Ch. 12.1 - Prob. 2LCCh. 12.1 - Automotive Trades The following bar graph shows...Ch. 12.1 - Trades Management The following graph shows the...Ch. 12.1 - General Interest The following double bar graph...Ch. 12.1 - General Interest The following stacked bar graph...Ch. 12.1 - Allied Health When Dr. Friedrich began working at...Ch. 12.1 - Automotive Trades The following line graph shows...Ch. 12.1 - Construction The following double-line graph...Ch. 12.1 - General Interest Study the circle graph at the top...
Ch. 12.1 - Prob. 9AECh. 12.1 - Allied Health An assistant at a pharmaceutical...Ch. 12.1 - Fire Protection Plot the following data as a bar...Ch. 12.1 - Transportation The following table lists the total...Ch. 12.1 - Metalworking Draw a bar graph from the following...Ch. 12.1 - Trades Management Plot the following data as a bar...Ch. 12.1 - Construction Plot the following data as a double...Ch. 12.1 - General Interest The following table shows the...Ch. 12.1 - Automotive Trades The following table shows the...Ch. 12.1 - Trades Management The following table shows the...Ch. 12.1 - General Interest The following table shows, by...Ch. 12.1 - Agriculture The following table shows the price...Ch. 12.1 - Allied Health The following table shows the...Ch. 12.1 - General Interest The following data show the U.S....Ch. 12.1 - Fire Protection The following data show the number...Ch. 12.1 - General Interest The following table shows the...Ch. 12.1 - Hydrology The following table shows the daily...Ch. 12.1 - Business and Finance Plot a double broken-line...Ch. 12.1 - Electrical Engineering Plot the following data as...Ch. 12.1 - Water/Wastewater Treatment The following table...Ch. 12.1 - Aviation An aircraft mechanic spends 12.5% of a...Ch. 12.1 - General Interest Recent surveys have shown that...Ch. 12.2 - Find the average of these numbers: 6, 8, 12, 14Ch. 12.2 - What number is halfway between 12 and 15?Ch. 12.2 - Find the mean, median, and mode for each set of...Ch. 12.2 - A. Find the mean, median, and mode for each set of...Ch. 12.2 - A. Find the mean, median, and mode for each set of...Ch. 12.2 - A. Find the mean, median, and mode for each set of...Ch. 12.2 - A. Find the mean, median, and mode for each set of...Ch. 12.2 - A. Find the mean, median, and mode for each set of...Ch. 12.2 - A. Find the mean, median, and mode for each set of...Ch. 12.2 - A. Find the mean, median, and mode for each set of...Ch. 12.2 - Construct an extended frequency distribution for...Ch. 12.2 - Construct an extended frequency distribution for...Ch. 12.2 - Aviation BF Goodrich produces brake pads for...Ch. 12.2 - General Trades The U.S. Department of Labor...Ch. 12.2 - Forestry The following table shows both the total...Ch. 12.2 - Water/Wastewater Treatment The seven-day mean of...Ch. 12.2 - Automotive Trades A mechanic has logged the...Ch. 12.2 - Forestry A forest ranger wishes to determine the...Ch. 12.2 - Hydrology The following table shows the monthly...Ch. 12.2 - Meteorology The National Weather Service provides...Ch. 12.2 - Automotive Trades The following table shows both...Ch. 12.2 - Hydrology The following table shows the daily...Ch. 12.2 - Allied Health The Apgar score is widely used to...Ch. 12.2 - Allied Health A pharmacist keeps careful track of...Ch. 12.2 - Prob. 13CECh. 12.2 - Prob. 14CECh. 12.3 - Calculate: 65 72.5Ch. 12.3 - Calculate: (2.5)2Ch. 12.3 - Prob. 1AECh. 12.3 - Prob. 2AECh. 12.3 - Prob. 3AECh. 12.3 - Calculate the range and the standard deviation for...Ch. 12.3 - Prob. 5AECh. 12.3 - Calculate the range and the standard deviation for...Ch. 12.3 - Prob. 7AECh. 12.3 - Prob. 8AECh. 12.3 - Prob. 1BECh. 12.3 - Prob. 2BECh. 12.3 - Prob. 3BECh. 12.3 - Calculate the standard deviation of the grouped...Ch. 12.3 - Prob. 1CECh. 12.3 - For each set of data, (a) calculate the standard...Ch. 12.3 - Prob. 1DECh. 12.3 - For each set of data, (a) calculate the standard...Ch. 12.3 - Prob. 1EECh. 12.3 - Prob. 2EECh. 12.3 - Prob. 3EECh. 12.3 - Prob. 4EECh. 12.3 - Prob. 5EECh. 12.3 - Prob. 6EECh. 12.3 - Prob. 7EECh. 12.3 - Prob. 8EECh. 12.3 - Prob. 9EECh. 12.3 - Prob. 10EECh. 12.3 - Prob. 11EECh. 12.3 - Prob. 12EECh. 12.3 - Prob. 13EECh. 12.3 - Automotive Trades In testing the acceleration from...Ch. 12 - Read bar graphs, line graphs, and circle graphs....Ch. 12 - Prob. 2PCh. 12 - Prob. 3PCh. 12 - Prob. 4PCh. 12 - Prob. 5PCh. 12 - Prob. 6PCh. 12 - Graph I Electrical Trades In general, as amps...Ch. 12 - Graph I Electrical Trades What is the minimum size...Ch. 12 - Graph I Electrical Trades What is the minimum wire...Ch. 12 - Prob. 4APSCh. 12 - Prob. 5APSCh. 12 - How many grams of fat are contained in a Peanut...Ch. 12 - How many grams of sugar are contained in a...Ch. 12 - How many grams of fat would you consume if you ate...Ch. 12 - How many grams of sugar would you consume if you...Ch. 12 - How many more grams of fat are in two Caramel...Ch. 12 - How many more grams of sugar are in three Peanut...Ch. 12 - Which cookie appears to be the healthiest (as...Ch. 12 - Which cookie appears to be the least healthy (as...Ch. 12 - By what percent does the amount of fat in a...Ch. 12 - By what percent does the amount of sugar in a...Ch. 12 - Retail Merchandising A small computer store is...Ch. 12 - Retail Merchandising A small computer store is...Ch. 12 - Retail Merchandising A small computer store is...Ch. 12 - Retail Merchandising A small computer store is...Ch. 12 - In September, what was the ratio of computer...Ch. 12 - Retail Merchandising A small computer store is...Ch. 12 - Retail Merchandising A small computer store is...Ch. 12 - Retail Merchandising A small computer store is...Ch. 12 - Graph IV Automotive Trades What was the cost per...Ch. 12 - Graph IV Automotive Trades When was the next time...Ch. 12 - Graph IV Automotive Trades During which time...Ch. 12 - Graph IV Automotive Trades During which time...Ch. 12 - Graph IV Automotive Trades What was the difference...Ch. 12 - Graph IV Automotive Trades By what percent did the...Ch. 12 - Graph IV Automotive Trades How much more did it...Ch. 12 - Graph V Business and Finance What was the actual...Ch. 12 - Graph V Business and Finance What was the...Ch. 12 - Graph V Business and Finance During which month...Ch. 12 - Graph V Business and Finance During which month...Ch. 12 - Graph V Business and Finance During which month...Ch. 12 - Graph V Business and Finance During which month...Ch. 12 - Graph V Business and Finance During which months...Ch. 12 - Graph V Business and Finance During which month...Ch. 12 - Graph VI Metalworking What percent of marine...Ch. 12 - Graph VI Metalworking What percent of this alloy...Ch. 12 - Graph VI Metalworking Without measuring, calculate...Ch. 12 - Graph VI Metalworking How many ounces of zinc are...Ch. 12 - Graph VI Metalworking How many grams of bismuth...Ch. 12 - Prob. 1BPSCh. 12 - General Interest The following table shows the...Ch. 12 - Prob. 3BPSCh. 12 - Prob. 4BPSCh. 12 - Prob. 5BPSCh. 12 - Prob. 6BPSCh. 12 - Metalworking Construct a circle graph based on the...Ch. 12 - Fire Protection Construct a circle graph based on...Ch. 12 - General Interest Students in a community college...Ch. 12 - C. Find the mean, median, and mode for each set of...Ch. 12 - C. Find the mean, median, and mode for each set of...Ch. 12 - C. Find the mean, median, and mode for each set of...Ch. 12 - C. Find the mean, median, and mode for each set of...Ch. 12 - Prob. 5CPSCh. 12 - C. Find the mean, median, and mode for each set of...Ch. 12 - D. Calculate (a) the range and (b) the standard...Ch. 12 - D. Calculate (a) the range and (b) the standard...Ch. 12 - Prob. 3DPSCh. 12 - Prob. 4DPSCh. 12 - E. Calculate the mean and the standard deviation...Ch. 12 - Prob. 2EPSCh. 12 - Prob. 1FPSCh. 12 - Meteorology The following table shows the average...Ch. 12 - Agriculture The following data from the United...Ch. 12 - Industrial Technology The Energy Information...Ch. 12 - Police Science To determine the speed that a...Ch. 12 - Agriculture The following list of numbers...Ch. 12 - Sheet Metal Trades The following data represent...Ch. 12 - Prob. 8FPSCh. 12 - Prob. 9FPS
Knowledge Booster


Learn more about
Need a deep-dive on the concept behind this application? Look no further. Learn more about this topic, subject and related others by exploring similar questions and additional content below.Similar questions
- Table 6 shows the year and the number ofpeople unemployed in a particular city for several years. Determine whether the trend appears linear. If so, and assuming the trend continues, in what year will the number of unemployed reach 5 people?arrow_forwardPlease choose one or more.arrow_forwardThe stacked column graph below shows additional information from the Bureau of Labor Statistics¹ about employment and education for two groups of workers in the United States compared with the graph discussed in the in-class activity. This graph includes data about workers aged 65 and older. Percentage Employment distribution of workers by education 1997 and 2007 2007 Age 65 and older Pocholode higher's degree. college or associate graduates college mless than a high school. diploma Part A: Use the graph to estimate the following information for the Age 65 and older group and complete the following table. 2007 Age 65 and older 1997 % % % % % % Bachelor's degree or higher Some college or associate degree High school graduates, no college % % Less than a high school diploma % AP % Totalarrow_forward
- II.arrow_forwardThe table below shows a recent graduate's credit card balance each month after graduation. Month 1 2 3 4 5 6 7 8 Debt ($) 620.00 761.88 899.80 1039.93 1270.63 1589.04 1851.31 2154.92 a) Look at the graph on your calculator. Based on this graph, what type of equation should represent this situation? Explain your answer. b) Use your calculator to find the equation that you feel best fits this data. What is the equation? c) Based on this equation, what is the predicted amount of debt for month 9 after graduation? View keyboard shortcuts EditViewInsertFormatToolsTable 12pt Paragrapharrow_forwardThe table below shows a recent graduate's credit card balance each month after graduation. Month 1 2 3 4 5 6 7 8 Debt ($) 620.00 761.88 899.80 1039.93 1270.63 1589.04 1851.31 2154.92 a) Look at the graph on your calculator. Based on this graph, what type of equation should represent this situation? Explain your answer. b) Use your calculator to find the equation that you feel best fits this data. What is the equation? c) Based on this equation, what is the predicted amount of debt for month 9 after graduation?arrow_forward
- Answer the circled onesarrow_forwardThe graph shows the weight of recyclable waste collected in a city from 2011 to 2014. Weight (Tons) 100 80 40 20 10 2011 2012 2013 2014 © 2020 StrongMind. Created using GeoGebra. Why is the graph misleading? The weights on the vertical axis are not evenly spaced. The years on the horizontal axis are not evenly spaced. The bars are too tall. The years are in the wrong order.arrow_forwardThe line graph below shows the average US price for one gallon of gasoline on the first Monday of each month from January 2008 to October 2011. Price (Dollars per Gallon) 4.00 3.50 3.00 2.50 2.00 1.50 8 1.00 0.50 Average Monthly U.S. Regular Gasoline Prices January, 2008 March, 2008 May, 2008 July, 2008 2008 September, 2008 November, 6002 Auenuer 2009 2009 March, 2009 2010 May, 2009 July, 2009 January, 2010 March, 2010 May, 2010 July, 2010 September, 2010 November, September, November, January, 2011 March, 2011 July, 2011 May, 2011 September, 2011 What was the relative change in the price of a gallon of gasoline from July 2008 to January 2009? Round to the nearest tenth of a percent. Remember (E-B)/Barrow_forward
- The following table gives the average monthly exchange rate between the U.S. dollar and the euro for 2009. It shows that 1 euro was equivalent to 1.289 U.S. dollars in January 2009. Develop a trend line that could be used to predict the exchange rate for 2010. Use this model to predict the exchange rate for January 2010 and February 2010. MONTH ______________________ EXCHANGE RATE January ....................................... 1.289 February ...................................... 1.324 March ......................................... 1.321 April .......................................... 1.317 May ........................................... 1.280 June ........................................... 1.254 July ........................................... 1.230 August ....................................... 1.240 September ................................... 1.287 October ..................................... 1.298 November .................................. 1.283 December…arrow_forwardThe diagram below illustrates the number of moose (red curve) and wolves (blue curve) between 1960 and 2015 in the Isle Royale National Park (USA). It does not show the actual data, but it approximates the trend. The vertical scale is from 0 to 50 for wolves and 0 to 2500 for moose. In certain years the moose population was decreasing and the wolf population was increasing. Which of the options below represents such a year? A. 1980 B. 1970 C. 2000 D. 2010arrow_forwardThe graph shows government receipts and outlays (both on-budget and off-budget) for 1991-2001. In what years did receipts appear to climb faster than outlays? Choose the correct answer below. OA. 1995, 1996, 1997 and 2001 OB. 1992, 1994, 1998 and 1999 O C. 1991, 1992, 1993 and 1994 D. 1991, 1998, 1999 and 2000 Billions of Dollars 4,400 4,000 3,600 3,200 2,800 2,400 2,000 Receipts Outlays 1991 92 93 94 95 96 97 Fiscal Years '98 '99 '00 '01 ...arrow_forward
arrow_back_ios
SEE MORE QUESTIONS
arrow_forward_ios
Recommended textbooks for you
 College AlgebraAlgebraISBN:9781305115545Author:James Stewart, Lothar Redlin, Saleem WatsonPublisher:Cengage Learning
 Glencoe Algebra 1, Student Edition, 9780079039897...AlgebraISBN:9780079039897Author:CarterPublisher:McGraw Hill
College Algebra
Algebra
ISBN:9781305115545
Author:James Stewart, Lothar Redlin, Saleem Watson
Publisher:Cengage Learning
Glencoe Algebra 1, Student Edition, 9780079039897...
Algebra
ISBN:9780079039897
Author:Carter
Publisher:McGraw Hill
What is a Relation? | Don't Memorise; Author: Don't Memorise;https://www.youtube.com/watch?v=hV1_wvsdJCE;License: Standard YouTube License, CC-BY
RELATIONS-DOMAIN, RANGE AND CO-DOMAIN (RELATIONS AND FUNCTIONS CBSE/ ISC MATHS); Author: Neha Agrawal Mathematically Inclined;https://www.youtube.com/watch?v=u4IQh46VoU4;License: Standard YouTube License, CC-BY