
EBK MATHEMATICS FOR THE TRADES
11th Edition
ISBN: 8220106960455
Author: CARMAN
Publisher: PEARSON
expand_more
expand_more
format_list_bulleted
Concept explainers
Videos
Textbook Question
Chapter 12.1, Problem 3AE
General Interest The following double bar graph shows the median annual earnings (in 2011–2012) of both recent college graduates and those with graduate degrees in six different occupational areas. Study the graph and answer the questions that follow.
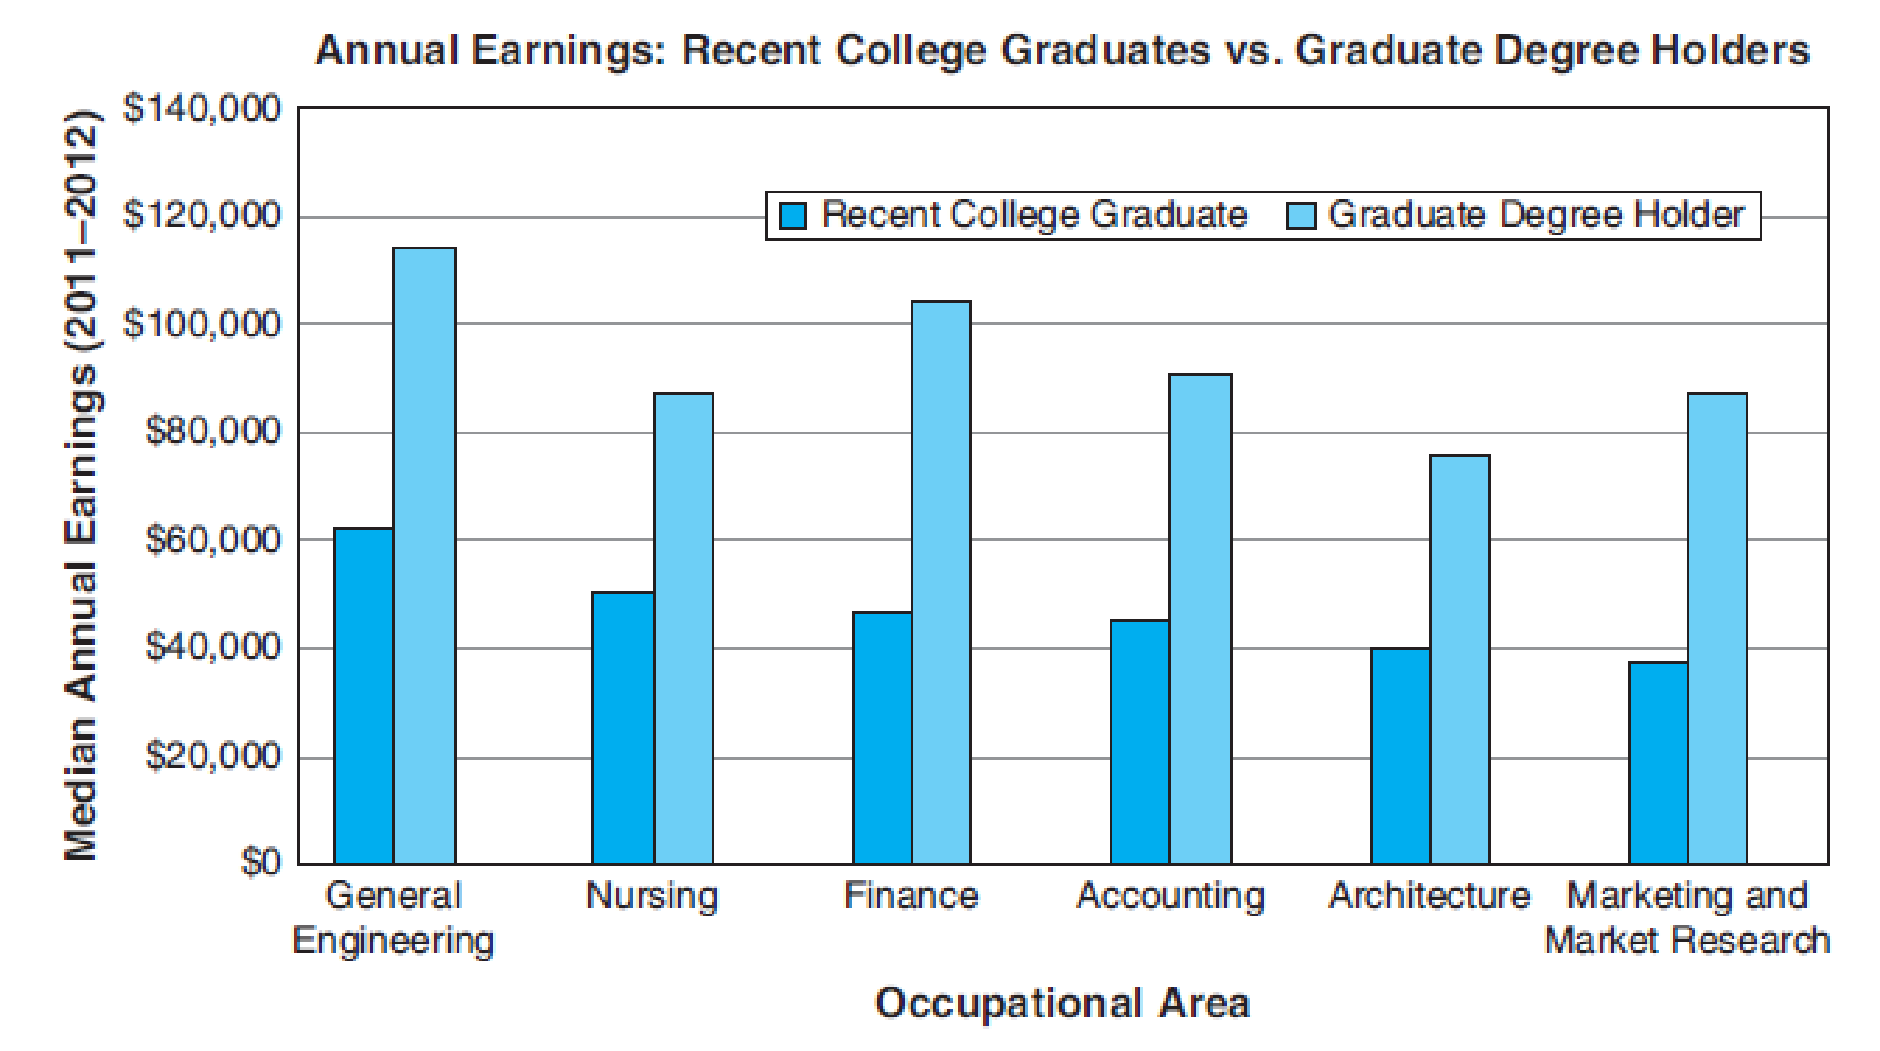
- (a) How much more did the average electrical engineer make compared to the average accountant if they were both recent college graduates?
- (b) In marketing and market research, how much more did the average graduate degree holder make compared to the average recent college graduate?
- (c) For architects, by what percent did the median earnings increase for those who held a graduate degree compared to those who were recent college graduates?
- (d) Answer the question in part (c) for nurses.
- (e) For which of the occupations shown did the median earnings increase the most for holders of graduate degrees?
Expert Solution & Answer
Want to see the full answer?
Check out a sample textbook solution
Students have asked these similar questions
The table shows the historical in-state tuition rates for the University of Kalamazoo. Use the data to answer the questions and round your answers to two decimal places.
Academic year
Rate of tuition for one semester
2008–2009
$3,812
2009–2010
$4,002
2010–2011
$4,441
2011–2012
$4,905
2012–2013
$5,181
What is the percentage increase in tuition from the 2008–2009 school year to the 2012–2013 school year?
Listed below is a company's sales in the period 2000 to 2011 along with the national income of the country, where the business is set up.
Year
National Income
(in millions of $)
Company's sales
(in thousands of $)
2000
305
470
2001
316
485
2002
358
499
2003
350
515
2004
375
532
2005
392
532
2006
400
556
2007
398
576
2008
430
583
2009
456
587
2010
578
601
2011
498
605
Consider the following as the estimated regression analysis using excel that could be used to estimate the company's yearly sales, given the yearly national income.
What is the estimated regression equation that can be used to predict the company's sales using the national income?
a. y^=328.9817+0.534x
b. y^=0.534+328.9817x
c. y=328.9817+0.534x
d. y=0.534+328.9817x
The financial aid office at Burke University
produced an internal report on the number of
students receiving scholarships.
Students receiving scholarships
Year
Students
2017
18
2018
35
2019
28
2020
30
2021
18
According to the table, what was the rate of
change between 2017 and 2018?
students per year
Chapter 12 Solutions
EBK MATHEMATICS FOR THE TRADES
Ch. 12.1 - Solve: 0.82=x100Ch. 12.1 - Prob. 2LCCh. 12.1 - Automotive Trades The following bar graph shows...Ch. 12.1 - Trades Management The following graph shows the...Ch. 12.1 - General Interest The following double bar graph...Ch. 12.1 - General Interest The following stacked bar graph...Ch. 12.1 - Allied Health When Dr. Friedrich began working at...Ch. 12.1 - Automotive Trades The following line graph shows...Ch. 12.1 - Construction The following double-line graph...Ch. 12.1 - General Interest Study the circle graph at the top...
Ch. 12.1 - Prob. 9AECh. 12.1 - Allied Health An assistant at a pharmaceutical...Ch. 12.1 - Fire Protection Plot the following data as a bar...Ch. 12.1 - Transportation The following table lists the total...Ch. 12.1 - Metalworking Draw a bar graph from the following...Ch. 12.1 - Trades Management Plot the following data as a bar...Ch. 12.1 - Construction Plot the following data as a double...Ch. 12.1 - General Interest The following table shows the...Ch. 12.1 - Automotive Trades The following table shows the...Ch. 12.1 - Trades Management The following table shows the...Ch. 12.1 - General Interest The following table shows, by...Ch. 12.1 - Agriculture The following table shows the price...Ch. 12.1 - Allied Health The following table shows the...Ch. 12.1 - General Interest The following data show the U.S....Ch. 12.1 - Fire Protection The following data show the number...Ch. 12.1 - General Interest The following table shows the...Ch. 12.1 - Hydrology The following table shows the daily...Ch. 12.1 - Business and Finance Plot a double broken-line...Ch. 12.1 - Electrical Engineering Plot the following data as...Ch. 12.1 - Water/Wastewater Treatment The following table...Ch. 12.1 - Aviation An aircraft mechanic spends 12.5% of a...Ch. 12.1 - General Interest Recent surveys have shown that...Ch. 12.2 - Find the average of these numbers: 6, 8, 12, 14Ch. 12.2 - What number is halfway between 12 and 15?Ch. 12.2 - Find the mean, median, and mode for each set of...Ch. 12.2 - A. Find the mean, median, and mode for each set of...Ch. 12.2 - A. Find the mean, median, and mode for each set of...Ch. 12.2 - A. Find the mean, median, and mode for each set of...Ch. 12.2 - A. Find the mean, median, and mode for each set of...Ch. 12.2 - A. Find the mean, median, and mode for each set of...Ch. 12.2 - A. Find the mean, median, and mode for each set of...Ch. 12.2 - A. Find the mean, median, and mode for each set of...Ch. 12.2 - Construct an extended frequency distribution for...Ch. 12.2 - Construct an extended frequency distribution for...Ch. 12.2 - Aviation BF Goodrich produces brake pads for...Ch. 12.2 - General Trades The U.S. Department of Labor...Ch. 12.2 - Forestry The following table shows both the total...Ch. 12.2 - Water/Wastewater Treatment The seven-day mean of...Ch. 12.2 - Automotive Trades A mechanic has logged the...Ch. 12.2 - Forestry A forest ranger wishes to determine the...Ch. 12.2 - Hydrology The following table shows the monthly...Ch. 12.2 - Meteorology The National Weather Service provides...Ch. 12.2 - Automotive Trades The following table shows both...Ch. 12.2 - Hydrology The following table shows the daily...Ch. 12.2 - Allied Health The Apgar score is widely used to...Ch. 12.2 - Allied Health A pharmacist keeps careful track of...Ch. 12.2 - Prob. 13CECh. 12.2 - Prob. 14CECh. 12.3 - Calculate: 65 72.5Ch. 12.3 - Calculate: (2.5)2Ch. 12.3 - Prob. 1AECh. 12.3 - Prob. 2AECh. 12.3 - Prob. 3AECh. 12.3 - Calculate the range and the standard deviation for...Ch. 12.3 - Prob. 5AECh. 12.3 - Calculate the range and the standard deviation for...Ch. 12.3 - Prob. 7AECh. 12.3 - Prob. 8AECh. 12.3 - Prob. 1BECh. 12.3 - Prob. 2BECh. 12.3 - Prob. 3BECh. 12.3 - Calculate the standard deviation of the grouped...Ch. 12.3 - Prob. 1CECh. 12.3 - For each set of data, (a) calculate the standard...Ch. 12.3 - Prob. 1DECh. 12.3 - For each set of data, (a) calculate the standard...Ch. 12.3 - Prob. 1EECh. 12.3 - Prob. 2EECh. 12.3 - Prob. 3EECh. 12.3 - Prob. 4EECh. 12.3 - Prob. 5EECh. 12.3 - Prob. 6EECh. 12.3 - Prob. 7EECh. 12.3 - Prob. 8EECh. 12.3 - Prob. 9EECh. 12.3 - Prob. 10EECh. 12.3 - Prob. 11EECh. 12.3 - Prob. 12EECh. 12.3 - Prob. 13EECh. 12.3 - Automotive Trades In testing the acceleration from...Ch. 12 - Read bar graphs, line graphs, and circle graphs....Ch. 12 - Prob. 2PCh. 12 - Prob. 3PCh. 12 - Prob. 4PCh. 12 - Prob. 5PCh. 12 - Prob. 6PCh. 12 - Graph I Electrical Trades In general, as amps...Ch. 12 - Graph I Electrical Trades What is the minimum size...Ch. 12 - Graph I Electrical Trades What is the minimum wire...Ch. 12 - Prob. 4APSCh. 12 - Prob. 5APSCh. 12 - How many grams of fat are contained in a Peanut...Ch. 12 - How many grams of sugar are contained in a...Ch. 12 - How many grams of fat would you consume if you ate...Ch. 12 - How many grams of sugar would you consume if you...Ch. 12 - How many more grams of fat are in two Caramel...Ch. 12 - How many more grams of sugar are in three Peanut...Ch. 12 - Which cookie appears to be the healthiest (as...Ch. 12 - Which cookie appears to be the least healthy (as...Ch. 12 - By what percent does the amount of fat in a...Ch. 12 - By what percent does the amount of sugar in a...Ch. 12 - Retail Merchandising A small computer store is...Ch. 12 - Retail Merchandising A small computer store is...Ch. 12 - Retail Merchandising A small computer store is...Ch. 12 - Retail Merchandising A small computer store is...Ch. 12 - In September, what was the ratio of computer...Ch. 12 - Retail Merchandising A small computer store is...Ch. 12 - Retail Merchandising A small computer store is...Ch. 12 - Retail Merchandising A small computer store is...Ch. 12 - Graph IV Automotive Trades What was the cost per...Ch. 12 - Graph IV Automotive Trades When was the next time...Ch. 12 - Graph IV Automotive Trades During which time...Ch. 12 - Graph IV Automotive Trades During which time...Ch. 12 - Graph IV Automotive Trades What was the difference...Ch. 12 - Graph IV Automotive Trades By what percent did the...Ch. 12 - Graph IV Automotive Trades How much more did it...Ch. 12 - Graph V Business and Finance What was the actual...Ch. 12 - Graph V Business and Finance What was the...Ch. 12 - Graph V Business and Finance During which month...Ch. 12 - Graph V Business and Finance During which month...Ch. 12 - Graph V Business and Finance During which month...Ch. 12 - Graph V Business and Finance During which month...Ch. 12 - Graph V Business and Finance During which months...Ch. 12 - Graph V Business and Finance During which month...Ch. 12 - Graph VI Metalworking What percent of marine...Ch. 12 - Graph VI Metalworking What percent of this alloy...Ch. 12 - Graph VI Metalworking Without measuring, calculate...Ch. 12 - Graph VI Metalworking How many ounces of zinc are...Ch. 12 - Graph VI Metalworking How many grams of bismuth...Ch. 12 - Prob. 1BPSCh. 12 - General Interest The following table shows the...Ch. 12 - Prob. 3BPSCh. 12 - Prob. 4BPSCh. 12 - Prob. 5BPSCh. 12 - Prob. 6BPSCh. 12 - Metalworking Construct a circle graph based on the...Ch. 12 - Fire Protection Construct a circle graph based on...Ch. 12 - General Interest Students in a community college...Ch. 12 - C. Find the mean, median, and mode for each set of...Ch. 12 - C. Find the mean, median, and mode for each set of...Ch. 12 - C. Find the mean, median, and mode for each set of...Ch. 12 - C. Find the mean, median, and mode for each set of...Ch. 12 - Prob. 5CPSCh. 12 - C. Find the mean, median, and mode for each set of...Ch. 12 - D. Calculate (a) the range and (b) the standard...Ch. 12 - D. Calculate (a) the range and (b) the standard...Ch. 12 - Prob. 3DPSCh. 12 - Prob. 4DPSCh. 12 - E. Calculate the mean and the standard deviation...Ch. 12 - Prob. 2EPSCh. 12 - Prob. 1FPSCh. 12 - Meteorology The following table shows the average...Ch. 12 - Agriculture The following data from the United...Ch. 12 - Industrial Technology The Energy Information...Ch. 12 - Police Science To determine the speed that a...Ch. 12 - Agriculture The following list of numbers...Ch. 12 - Sheet Metal Trades The following data represent...Ch. 12 - Prob. 8FPSCh. 12 - Prob. 9FPS
Knowledge Booster


Learn more about
Need a deep-dive on the concept behind this application? Look no further. Learn more about this topic, subject and related others by exploring similar questions and additional content below.Similar questions
- Use this data for the exercises that follow: In 2013, there were roughly 317 million citizens in the United States, and about 40 million were elderly (aged 65 and over).[34] 60. It is predicted that by 2030, one in five U.S. citizens will be elderly. How much greater will the chances of meeting an elderly person be at that time? What policy changes do you foresee if these statistics hold true?arrow_forwardThe Seneca Children’s Fund (SCF) is a local charity that runs a summer camp for disadvantaged children. The fund’s board of directors has been working very hard over recent years to decrease the amount of overhead expenses, a major factor in how charities are rated by independent agencies. The following data show the percentage of the money SCF has raised that was spent on administrative and fund-raising expenses over the past seven years: Year Period (t) Expense (%) 2003 1 13.9 2004 2 12.2 2005 3 10.5 2006 4 10.4 2007 5 11.5 2008 6 10.0 2009 7 8.5 a. Construct a time series plot. What type of pattern exists in the data?b. Use simple linear regression analysis to find the parameters for the line that minimizes MSE for this time series.c. Forecast the percentage of administrative expenses for year 8.d. If SCF can maintain its current trend in reducing administrative expenses, how long will it take for SCF to achieve a level of 5% or less?arrow_forwardIn 2011 home prices and mortgage rates dropped so low that in a number of cities the monthly cost of owning a home was less expensive than renting. The following data show the average asking rent for 10 markets and the monthly mortgage on the median priced home (including taxes and insurance) for 10 cities where the average monthly mortgage payment was less than the average asking rent (The Wall Street Journal, November 26–27, 2011).Click on the datafile logo to reference the data. Enter negative values as negative numbers. a. Develop the estimated regression equation that can be used to predict the monthly mortgage given the average asking rent (to 2 decimals).The regression equation is:Mortgage ($) = + Rent ($)arrow_forward
- Park City, Utah was settled as a mining community in 1870 and experienced growth until the late 1950s when the price of silver dropped. In the past 40 years, Park City has experienced new growth as a thriving ski resort. The population data for selected years between 1900 and 2009 are given below. Park City, Utah Year 1900 1930 1940 1950 1970 1980 1990 2000 2009 Population 3759 4281 3739 2254 1193 2823 4468 7341 11983 (a) What behavior of a scatter plot of the data indicates that a cubic model is appropriate? O a change in concavity and neither a relative maximum nor a relative minimum O a change in concavity and both a relative maximum and a relative minimum O no change in concavity and an absolute minimum O no change in concavity and an absolute maximum (b) Align the input so that t = 0 in 1900. Find a cubic model for the data. (Round all numerical values to three decimal places.) p(t) = (c) Numerically estimate the derivative of the model in 2007 to the nearest hundred. p'(107) =…arrow_forwardA magazine published data on the best small firms in a certain year. These were firms which had been publicly traded for at least a year, have a stock price of at least $5 per share, and have reported annual revenue between $5 million and $1 billion. Thtable below shows the ages of the chief executive officers for the first 66 ranked firms. Age Frequency Relative Frequency Cumulative Relative Frequency 40-44 45-49 50-54 55-59 60-64 10 65-69 6 70-74 1 (a) What is the frequency for CEO ages between (but not including) 54 and 65? (Enter your answer as a whole number.) 22 (b) What percentage of CEOS are 65 years or older? (Round your answer to the nearest whole number.) (c) What is the relative frequency of ages under 50? (Round your answer to two decimal places.) 0.29 (d) What is the cumulative relative frequency for CEOS younger than 55? (Round your answer to two decimal places.) 0.59arrow_forwardPlease give correct answer ASAP.arrow_forward
- Below are percentages for annual sales growth and net sales attributed to loyalty card usage at 74 Noodles & Company restaurants. Annual Sales Growth (%) and Loyalty Card Usage (% of Net Sales)(n = 74 restaurants) Store Growth% Loyalty% Store Growth% Loyalty% 1 -8.3 2.1 38 7.1 1.6 2 -4.0 2.5 39 7.4 1.8 3 -3.9 1.7 40 7.7 2.2 4 -3.4 2.1 41 7.9 2.2 5 -3.3 2.5 42 8.1 2.8 6 -1.9 3.0 43 8.3 2.4 7 -0.8 2.3 44 8.5 3.1 8 -0.4 2.3 45 8.6 2.2 9 -0.2 2.2 46 8.7 1.3 10 -0.2 2.3 47 8.8 1.8 11 0.5 2.1 48 8.8 2.5 12 0.6 2.5 49 8.9 1.9 13 0.8 2.0 50 9.1 2.0 14 1.9 2.0 51 9.5 2.4 15 2.0 2.0 52 10.2 2.2 16…arrow_forwardExample: From the following data, find out the mean profits: Profits per 200- 219 220-239 240-259 260-279 280 - 299 Shop (OMR) No of shops 20 38 40 18 34arrow_forwardASAP!! ANSWER A sample of 20 financial analysts was asked to provide forecasts of earnings per share of a corporation for next year. The results are summarized in the following table: Forecast ($ per share) Number of Analysts$9.95 to under $10.45 2$10.45 to under $10.95 8$10.95 to under $11.45 6$11.45 to under $11.95 3$11.95 to under $12.45 1 (i). Estimate the sample mean forecast.(ii). Estimate the sample Median. (iii) Estimate the sample Mode forecast. (iv) Estimate the sample Variance forecast. (v) Estimate the sample Standard Deviation forecast.arrow_forward
- A magazine published data on the best small firms in a certain year. These were firms which had been publicly traded for at least a year, have a stock price of at least $5 per share, and have reported annual revenue between $5 million and $1 billion. The table below shows the ages of the chief executive officers for the first 64 ranked firms. Relative Frequency Age 40-44 3 45-49 11 50-54 19 55-59 60-64 10 65-69 2 70-74 1 Frequency Cumulative Relative Frequency (a) What is the frequency for CEO ages between (but not including) 54 and 65? (Enter your answer as a whole number.) 28 (b) What percentage of CEOs are 65 years or older? (Round your answer to the nearest whole number.) 8 (c) What is the relative frequency of ages under 50? (Round your answer to two decimal places.) 0.23 (d) What is the cumulative relative frequency for CEOs younger than 55? (Round your answer to two decimal places.) 0.47 (e) Which graph shows the relative frequency? Relative Frequency 1.0 0.8 0.6 Relative…arrow_forwardBelow are percentages for annual sales growth and net sales attributed to loyalty card usage at 74 Noodles & Company restaurants. Annual Sales Growth (px;) and Loyalty Card Usage (px; of Net Sales)(n = 74 restaurants) Store Growth% Loyalty% Store Growth% Loyalty% 1 -7.8 0.7 38 7.3 1.5 2 -6.9 2.5 39 7.4 1.7 3 -5.1 1.6 40 7.7 2.3 4 -4.7 1.4 41 8.0 2.0 5 -3.8 2.5 42 8.0 1.6 6 -1.7 1.5 43 8.3 1.9 7 -1.7 2.6 44 8.4 2.0 8 -1.6 2.4 45 8.6 2.2 9 -1.1 2.2 46 8.6 1.6 10 -1.0 1.9 47 8.7 0.9 11 0.4 1.2 48 8.9 1.7 12 0.6 0.5 49 9.4 1.6 13 0.6 2.1 50 9.5 1.3 14 1.0 1.3 51 9.5 2.1 15 1.3 2.0 52 10.5…arrow_forwardA magazine published data on the best small firms in a certain year. These were firms which had been publicly traded for at least a year, have a stock price of at least $5 per share, and have reported annual revenue between $5 million and $1 billion. The table below shows the ages of the chief executive officers for the first 70 ranked firms. Cumulative Relative Age Frequency Relative Frequency Frequency 40-44 45-49 11 50-54 19 55-59 16 60-64 10 65-69 8 70-74 (a) What is the frequency for CEO ages between (but not including) 54 and 65? (Enter your answer as a whole number.) (b) What percentage of CEOS are 65 years or older? (Round your answer to the nearest whole number.) % (c) What is the relative frequency of ages under 50? (Round your answer to two decimal places.) (d) What is the cumulative relative frequency for CEOS younger than 55? (Round your answer to two decimal places.)arrow_forward
arrow_back_ios
SEE MORE QUESTIONS
arrow_forward_ios
Recommended textbooks for you

 Glencoe Algebra 1, Student Edition, 9780079039897...AlgebraISBN:9780079039897Author:CarterPublisher:McGraw Hill
Glencoe Algebra 1, Student Edition, 9780079039897...
Algebra
ISBN:9780079039897
Author:Carter
Publisher:McGraw Hill
Use of ALGEBRA in REAL LIFE; Author: Fast and Easy Maths !;https://www.youtube.com/watch?v=9_PbWFpvkDc;License: Standard YouTube License, CC-BY
Compound Interest Formula Explained, Investment, Monthly & Continuously, Word Problems, Algebra; Author: The Organic Chemistry Tutor;https://www.youtube.com/watch?v=P182Abv3fOk;License: Standard YouTube License, CC-BY
Applications of Algebra (Digit, Age, Work, Clock, Mixture and Rate Problems); Author: EngineerProf PH;https://www.youtube.com/watch?v=Y8aJ_wYCS2g;License: Standard YouTube License, CC-BY