
EBK MATHEMATICS FOR THE TRADES
11th Edition
ISBN: 8220106960455
Author: CARMAN
Publisher: PEARSON
expand_more
expand_more
format_list_bulleted
Concept explainers
Videos
Textbook Question
Chapter 12.1, Problem 4AE
General Interest The following stacked bar graph shows total movie ticket sales worldwide from 2010–2015. The lower section of each bar indicates box-office receipts for the United States and Canada, while the upper section shows the international receipts. The vertical scale is in billions of dollars. Study the graph and answer the questions that follow.
Worldwide Movie Ticket Sales (2010–2015)
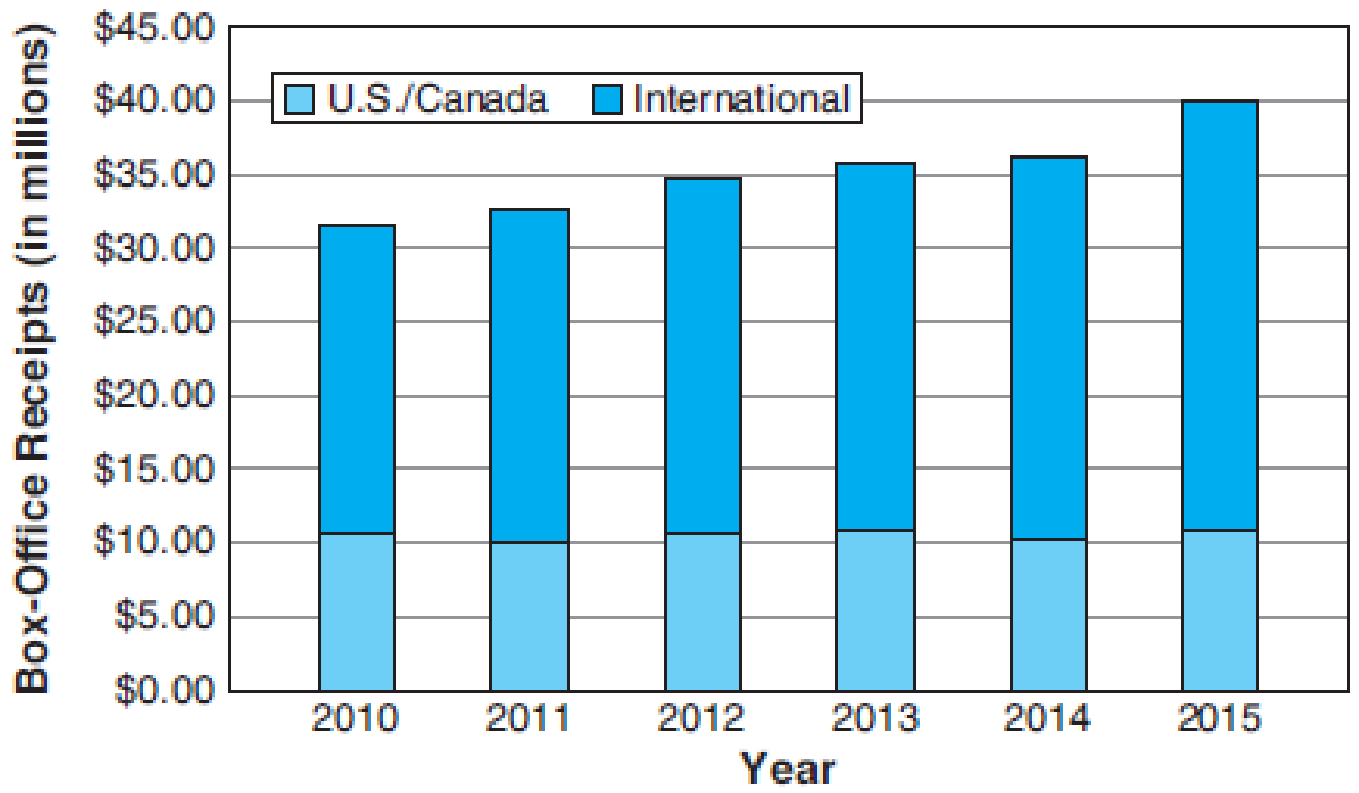
- (a) What does the graph tell you in general about the growth of international ticket sales versus the growth of U.S. and Canadian sales?
- (b) What was the U.S. and Canadian total in 2011?
- (c) What was the international total for 2014?
- (d) By what percent did international ticket sales increase from 2010 to 2015?
- (e) What percent of total ticket sales came from the U.S. and Canada in 2010? In 2015?
Expert Solution & Answer
Want to see the full answer?
Check out a sample textbook solution
Students have asked these similar questions
Complete Part D
A recent issue of the AARP Bulletin reported that the average weekly pay for a woman with a high school degree is $520 (AARP Bulletin, January–February, 2010). Suppose you would like to determine if the average weekly pay for all working women is significantly greater than that for women with a high school degree. Data providing the weekly pay for a sample of 50 working women are available in the file named WeeklyPay. These data are consistent with the findings reported in the AARP article. Complete D
null hyposthesis: H(o)=520Alternative hypothesis: H(a): greater then 520
sample mean=637.94
the test statistic = 5.62
p-value=0.00
Using a=.05, we would reject the null hypothesis.
D. Repeat the hypothesis test using the critical value approach.
582
333
759
633
629
523
320
685
599
753
553
641
290
800
696
627
679
667
542
619
950
614
548
570
678
697
750
569…
Part c please
Only data that shows positive trends can be graphed in a scatter diagram.
True
O False
Chapter 12 Solutions
EBK MATHEMATICS FOR THE TRADES
Ch. 12.1 - Solve: 0.82=x100Ch. 12.1 - Prob. 2LCCh. 12.1 - Automotive Trades The following bar graph shows...Ch. 12.1 - Trades Management The following graph shows the...Ch. 12.1 - General Interest The following double bar graph...Ch. 12.1 - General Interest The following stacked bar graph...Ch. 12.1 - Allied Health When Dr. Friedrich began working at...Ch. 12.1 - Automotive Trades The following line graph shows...Ch. 12.1 - Construction The following double-line graph...Ch. 12.1 - General Interest Study the circle graph at the top...
Ch. 12.1 - Prob. 9AECh. 12.1 - Allied Health An assistant at a pharmaceutical...Ch. 12.1 - Fire Protection Plot the following data as a bar...Ch. 12.1 - Transportation The following table lists the total...Ch. 12.1 - Metalworking Draw a bar graph from the following...Ch. 12.1 - Trades Management Plot the following data as a bar...Ch. 12.1 - Construction Plot the following data as a double...Ch. 12.1 - General Interest The following table shows the...Ch. 12.1 - Automotive Trades The following table shows the...Ch. 12.1 - Trades Management The following table shows the...Ch. 12.1 - General Interest The following table shows, by...Ch. 12.1 - Agriculture The following table shows the price...Ch. 12.1 - Allied Health The following table shows the...Ch. 12.1 - General Interest The following data show the U.S....Ch. 12.1 - Fire Protection The following data show the number...Ch. 12.1 - General Interest The following table shows the...Ch. 12.1 - Hydrology The following table shows the daily...Ch. 12.1 - Business and Finance Plot a double broken-line...Ch. 12.1 - Electrical Engineering Plot the following data as...Ch. 12.1 - Water/Wastewater Treatment The following table...Ch. 12.1 - Aviation An aircraft mechanic spends 12.5% of a...Ch. 12.1 - General Interest Recent surveys have shown that...Ch. 12.2 - Find the average of these numbers: 6, 8, 12, 14Ch. 12.2 - What number is halfway between 12 and 15?Ch. 12.2 - Find the mean, median, and mode for each set of...Ch. 12.2 - A. Find the mean, median, and mode for each set of...Ch. 12.2 - A. Find the mean, median, and mode for each set of...Ch. 12.2 - A. Find the mean, median, and mode for each set of...Ch. 12.2 - A. Find the mean, median, and mode for each set of...Ch. 12.2 - A. Find the mean, median, and mode for each set of...Ch. 12.2 - A. Find the mean, median, and mode for each set of...Ch. 12.2 - A. Find the mean, median, and mode for each set of...Ch. 12.2 - Construct an extended frequency distribution for...Ch. 12.2 - Construct an extended frequency distribution for...Ch. 12.2 - Aviation BF Goodrich produces brake pads for...Ch. 12.2 - General Trades The U.S. Department of Labor...Ch. 12.2 - Forestry The following table shows both the total...Ch. 12.2 - Water/Wastewater Treatment The seven-day mean of...Ch. 12.2 - Automotive Trades A mechanic has logged the...Ch. 12.2 - Forestry A forest ranger wishes to determine the...Ch. 12.2 - Hydrology The following table shows the monthly...Ch. 12.2 - Meteorology The National Weather Service provides...Ch. 12.2 - Automotive Trades The following table shows both...Ch. 12.2 - Hydrology The following table shows the daily...Ch. 12.2 - Allied Health The Apgar score is widely used to...Ch. 12.2 - Allied Health A pharmacist keeps careful track of...Ch. 12.2 - Prob. 13CECh. 12.2 - Prob. 14CECh. 12.3 - Calculate: 65 72.5Ch. 12.3 - Calculate: (2.5)2Ch. 12.3 - Prob. 1AECh. 12.3 - Prob. 2AECh. 12.3 - Prob. 3AECh. 12.3 - Calculate the range and the standard deviation for...Ch. 12.3 - Prob. 5AECh. 12.3 - Calculate the range and the standard deviation for...Ch. 12.3 - Prob. 7AECh. 12.3 - Prob. 8AECh. 12.3 - Prob. 1BECh. 12.3 - Prob. 2BECh. 12.3 - Prob. 3BECh. 12.3 - Calculate the standard deviation of the grouped...Ch. 12.3 - Prob. 1CECh. 12.3 - For each set of data, (a) calculate the standard...Ch. 12.3 - Prob. 1DECh. 12.3 - For each set of data, (a) calculate the standard...Ch. 12.3 - Prob. 1EECh. 12.3 - Prob. 2EECh. 12.3 - Prob. 3EECh. 12.3 - Prob. 4EECh. 12.3 - Prob. 5EECh. 12.3 - Prob. 6EECh. 12.3 - Prob. 7EECh. 12.3 - Prob. 8EECh. 12.3 - Prob. 9EECh. 12.3 - Prob. 10EECh. 12.3 - Prob. 11EECh. 12.3 - Prob. 12EECh. 12.3 - Prob. 13EECh. 12.3 - Automotive Trades In testing the acceleration from...Ch. 12 - Read bar graphs, line graphs, and circle graphs....Ch. 12 - Prob. 2PCh. 12 - Prob. 3PCh. 12 - Prob. 4PCh. 12 - Prob. 5PCh. 12 - Prob. 6PCh. 12 - Graph I Electrical Trades In general, as amps...Ch. 12 - Graph I Electrical Trades What is the minimum size...Ch. 12 - Graph I Electrical Trades What is the minimum wire...Ch. 12 - Prob. 4APSCh. 12 - Prob. 5APSCh. 12 - How many grams of fat are contained in a Peanut...Ch. 12 - How many grams of sugar are contained in a...Ch. 12 - How many grams of fat would you consume if you ate...Ch. 12 - How many grams of sugar would you consume if you...Ch. 12 - How many more grams of fat are in two Caramel...Ch. 12 - How many more grams of sugar are in three Peanut...Ch. 12 - Which cookie appears to be the healthiest (as...Ch. 12 - Which cookie appears to be the least healthy (as...Ch. 12 - By what percent does the amount of fat in a...Ch. 12 - By what percent does the amount of sugar in a...Ch. 12 - Retail Merchandising A small computer store is...Ch. 12 - Retail Merchandising A small computer store is...Ch. 12 - Retail Merchandising A small computer store is...Ch. 12 - Retail Merchandising A small computer store is...Ch. 12 - In September, what was the ratio of computer...Ch. 12 - Retail Merchandising A small computer store is...Ch. 12 - Retail Merchandising A small computer store is...Ch. 12 - Retail Merchandising A small computer store is...Ch. 12 - Graph IV Automotive Trades What was the cost per...Ch. 12 - Graph IV Automotive Trades When was the next time...Ch. 12 - Graph IV Automotive Trades During which time...Ch. 12 - Graph IV Automotive Trades During which time...Ch. 12 - Graph IV Automotive Trades What was the difference...Ch. 12 - Graph IV Automotive Trades By what percent did the...Ch. 12 - Graph IV Automotive Trades How much more did it...Ch. 12 - Graph V Business and Finance What was the actual...Ch. 12 - Graph V Business and Finance What was the...Ch. 12 - Graph V Business and Finance During which month...Ch. 12 - Graph V Business and Finance During which month...Ch. 12 - Graph V Business and Finance During which month...Ch. 12 - Graph V Business and Finance During which month...Ch. 12 - Graph V Business and Finance During which months...Ch. 12 - Graph V Business and Finance During which month...Ch. 12 - Graph VI Metalworking What percent of marine...Ch. 12 - Graph VI Metalworking What percent of this alloy...Ch. 12 - Graph VI Metalworking Without measuring, calculate...Ch. 12 - Graph VI Metalworking How many ounces of zinc are...Ch. 12 - Graph VI Metalworking How many grams of bismuth...Ch. 12 - Prob. 1BPSCh. 12 - General Interest The following table shows the...Ch. 12 - Prob. 3BPSCh. 12 - Prob. 4BPSCh. 12 - Prob. 5BPSCh. 12 - Prob. 6BPSCh. 12 - Metalworking Construct a circle graph based on the...Ch. 12 - Fire Protection Construct a circle graph based on...Ch. 12 - General Interest Students in a community college...Ch. 12 - C. Find the mean, median, and mode for each set of...Ch. 12 - C. Find the mean, median, and mode for each set of...Ch. 12 - C. Find the mean, median, and mode for each set of...Ch. 12 - C. Find the mean, median, and mode for each set of...Ch. 12 - Prob. 5CPSCh. 12 - C. Find the mean, median, and mode for each set of...Ch. 12 - D. Calculate (a) the range and (b) the standard...Ch. 12 - D. Calculate (a) the range and (b) the standard...Ch. 12 - Prob. 3DPSCh. 12 - Prob. 4DPSCh. 12 - E. Calculate the mean and the standard deviation...Ch. 12 - Prob. 2EPSCh. 12 - Prob. 1FPSCh. 12 - Meteorology The following table shows the average...Ch. 12 - Agriculture The following data from the United...Ch. 12 - Industrial Technology The Energy Information...Ch. 12 - Police Science To determine the speed that a...Ch. 12 - Agriculture The following list of numbers...Ch. 12 - Sheet Metal Trades The following data represent...Ch. 12 - Prob. 8FPSCh. 12 - Prob. 9FPS
Knowledge Booster


Learn more about
Need a deep-dive on the concept behind this application? Look no further. Learn more about this topic, subject and related others by exploring similar questions and additional content below.Similar questions
- Stock Market The week of September 15, 2008 was one of the most volatile weeks ever for the US stock market. The closing numbers of the Dow Jones Industrial Average each day were: What was the overall change for the week? Was it positive or negative?arrow_forwardHow do I put this in a scatter plot with per-capita real GDP in 1960 (relative to the USA in 1960) on the horizontal axis and the average per-capita growth rate of GDP on the vertical axis? Also when you hover over the separate points would it show what the country code is?arrow_forwardThe bar graph shows the average cost of tuition and fees at private four-year colleges in a particular country. Below are two mathematical models for the data shown in the graph. In each formula, T represents the average cost of tuition and fees at private colleges for the school year ending x years after 2000. Answer parts a and b. Average Cost of Tuition and Fees at Private Four-Year Colleges 22 20- 22,051 21,057 20,095 19,128 18,135 18- 16.203 16 15 218 17,168 Model 1 T= 974x+ 15,223 Model 2 T= - 2.1x + 988x + 15,208 14 2000 2001 20022003 2004 2005 2006 2007 a. Use each model to find the average cost of tuition and fees at private colleges for the school vear ending in 2003. By how much does each model underestimate or overestimate the actual cost shown for the school year ending in 2003? HIHE The average cost given by model 1 is $ Round to the nearest dollar.) Help Me Solve This Textbook Get More Help - Clear All Skill Builder Check Answer 10.19 PM 65°F 9/6/2021 Type here to search…arrow_forward
- The data in the picture contains purchase data for golf purchases. Create a doughnut chart in Excel to compare the purchases by gender each year with the US population. Below the chart, explain what it illustrates.arrow_forwardUse the graph below, which shows the average number of weekly viewers of a 30- minute television program (in millions of viewers) from 2000 to 2006. milions of viewers 30 25- ខ 15- 10- 5 2000 2001 2002 2003 2004 2005 2006 year Select one: a. (2001, 2004, 2006} b. (2002, 2003, 2005} c. {1001, 2002, 2005} d. {2004}arrow_forwardPlease solve the problemarrow_forward
- Total revenue for a soda in January 2011 was $4,342,262, and total revenue in January 2013 was $4,429,964. See the data below. The soda company is requesting your help as manager to understand how price increases are affecting the quantity of sodas sold. Create a table with the descriptive statistics of the number of sodas sold in the two years, as well as an explanation of the descriptive statistics: What are some of the key aspects of the descriptive statistics that help you tell a story about the 2 years in sodas sold. Run a regression where you explain how price changes are affecting the quantity of sodas sold. Include an explanation of the coefficients as well as an explanation of the t-statistics, the intercept, the R-Squared, and the F-Statistic. Explain managerial recommendations to the soda company on how can you increase the revenue.arrow_forwardPage of 11 ZOOM + 5. The table shows how the cost of a carne asada taco at my favorite taco stand has increased as they have become more popular since their opening in 2013. Use the data to answer the questions below. Year, x 2013, 0 2014, 1 2015, 2 2016, 3 2017, 4 2018, 5 2019,6 Cost ($) 0.50 0.55 0.65 0.75 0.90 1.00 1.10 (a) What is the regression line given by your TI-84 for this data? Round values to 3 decimal places. (b) Using the regression equation above, predict the cost of a carne asada taco at my favorite taco stand in 2020. Show the work.arrow_forwardObesity Prevalence Trends in Texas Adults, 1990 to 2009 57.1% S0% 30% 30.0% 20% 12.3% Source: U.S. Centers for Disease Control and Prevention. Use this graph to answer the following questions: 1. Write a detailed description of what this graph is showing. 2. From 1990 -2009 how did the percentage of obese adults in Texas change? (Be specific) 3. What lifestyle choices do you believe contributed to the increase from 1990-2009? (Be specific and elaborate) 4. What is the total percentage of Texans who were overweight and obese in 2009?arrow_forward
- I'm running out of questions. Can I pay for 30 more extra?arrow_forwardThe stacked column graph below shows additional information from the Bureau of Labor Statistics¹ about employment and education for two groups of workers in the United States compared with the graph discussed in the in-class activity. This graph includes data about workers aged 65 and older. Percentage Employment distribution of workers by education 1997 and 2007 2007 Age 65 and older Pocholode higher's degree. college or associate graduates college mless than a high school. diploma Part A: Use the graph to estimate the following information for the Age 65 and older group and complete the following table. 2007 Age 65 and older 1997 % % % % % % Bachelor's degree or higher Some college or associate degree High school graduates, no college % % Less than a high school diploma % AP % Totalarrow_forwardcreate a diagram of the situation 81% of college students take online classes, 36% online students have gained more than 5 pounds in last 6 months 15% students did not take online gained 5 pounds in the last 6 months.arrow_forward
arrow_back_ios
SEE MORE QUESTIONS
arrow_forward_ios
Recommended textbooks for you
 Elementary AlgebraAlgebraISBN:9780998625713Author:Lynn Marecek, MaryAnne Anthony-SmithPublisher:OpenStax - Rice University
 Glencoe Algebra 1, Student Edition, 9780079039897...AlgebraISBN:9780079039897Author:CarterPublisher:McGraw Hill
Elementary Algebra
Algebra
ISBN:9780998625713
Author:Lynn Marecek, MaryAnne Anthony-Smith
Publisher:OpenStax - Rice University
Glencoe Algebra 1, Student Edition, 9780079039897...
Algebra
ISBN:9780079039897
Author:Carter
Publisher:McGraw Hill
Correlation Vs Regression: Difference Between them with definition & Comparison Chart; Author: Key Differences;https://www.youtube.com/watch?v=Ou2QGSJVd0U;License: Standard YouTube License, CC-BY
Correlation and Regression: Concepts with Illustrative examples; Author: LEARN & APPLY : Lean and Six Sigma;https://www.youtube.com/watch?v=xTpHD5WLuoA;License: Standard YouTube License, CC-BY