Concept explainers
Videos
Given the bivariate data
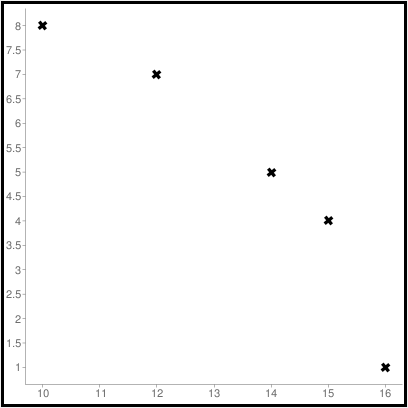
a. Draw a scatter diagram for the data.
b. Find
c. Find a. the slope of the least-squares regression line, and b, the y-intercept of the least-squares line.
d. Draw the least-squares line on the scatter diagram from part a.
e. Is the point
f. Use the equation of the least-squares line to predict the value of y for x = 8.
g. Find the linear

Trending nowThis is a popular solution!

Chapter 13 Solutions
Mathematical Excursions (MindTap Course List)


 Linear Algebra: A Modern IntroductionAlgebraISBN:9781285463247Author:David PoolePublisher:Cengage Learning
 Glencoe Algebra 1, Student Edition, 9780079039897...AlgebraISBN:9780079039897Author:CarterPublisher:McGraw Hill