Student's Solutions Manual To Accompany Elementary Statistics Tenth Edition
10th Edition
ISBN: 9780321470409
Author: Milton Loyer, Mario F. Triola
Publisher: PEARSON
expand_more
expand_more
format_list_bulleted
Videos
Textbook Question
Chapter 13, Problem 7RE
Using Nonparametric Tests. In Exercises 1–10, use a 0.05 significance level with the indicated test. If no particular test is specified, use the appropriate nonparametric test from this chapter.
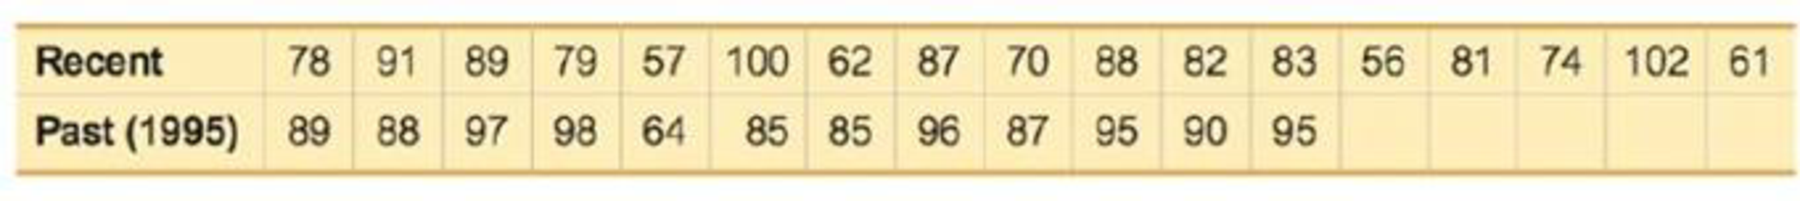
7. Old Faithful Listed below are time intervals (min) between eruptions of the Old Faithful geyser. The “recent” times are within the past few years, and the “past” times are from 1995. Test the claim that the two samples are from populations with the same median. Does the conclusion change with a 0.01 significance level?
Expert Solution & Answer
Want to see the full answer?
Check out a sample textbook solution
Students have asked these similar questions
Test the claim about the population mean, μ, at the given level of significance using the given sample statistics. Claim: μ≠6000; α=0.08; σ=391. Sample statistics: x=5900, n=49
Determine the outcome and conclusion of the test. Choose from the following. A. Reject H0. At the 8% significance level, there is enough evidence to support the claim. B. Fail to reject H0. At the 8% significance level, there is not enough evidence to support the claim. C. Fail to reject H0. At the 8% significance level, there is not enough evidence to reject the claim. D. Reject H0. At the 8% significance level, there is enough evidence to reject the claim.
Identify the null hypothesis, alternative hypothesis, test statistic, P-value, conclusion about the null hypothesis, and final conclusion that addresses the original claim. Various temperature measurements are recorded at different times for a particular city. The mean of 20°C is obtained for 60 temperatures on 60 different days. Assuming that Η = 1.5°C, test the claim that the population mean is 22°C. Use a 0.05 significance level.
1. a. You want to estimate the mean hourly yield for a process that manufactures an antibiotic. You observe the process for 50 hourly periods chosen at random, with the results ?̅= 31 ounces per hour and ? = 3. Estimate the mean hourly yield for the process using a 90% and 95% confidence interval.
no 2 di foto
Chapter 13 Solutions
Student's Solutions Manual To Accompany Elementary Statistics Tenth Edition
Ch. 13.2 - Prob. 1BSCCh. 13.2 - Prob. 2BSCCh. 13.2 - Contradicting H1 An important step in conducting...Ch. 13.2 - Efficiency of the Sign Test Refer to Table 13-2 on...Ch. 13.2 - Matched Pairs. In Exercises 58, use the sign test...Ch. 13.2 - Matched Pairs. In Exercises 58, use the sign test...Ch. 13.2 - Matched Pairs. In Exercises 58, use the sign test...Ch. 13.2 - Matched Pairs. In Exercises 58, use the sign test...Ch. 13.2 - Nominal Data. In Exercises 912, use the sign test...Ch. 13.2 - Nominal Data. In Exercises 912, use the sign test...
Ch. 13.2 - Nominal Data. In Exercises 912, use the sign test...Ch. 13.2 - Nominal Data. In Exercises 912, use the sign test...Ch. 13.2 - Appendix B Data Sets. In Exercises 1316, refer to...Ch. 13.2 - Appendix B Data Sets. In Exercises 1316, refer to...Ch. 13.2 - Appendix B Data Sets. In Exercises 1316, refer to...Ch. 13.2 - Appendix B Data Sets. In Exercises 1316, refer to...Ch. 13.2 - Procedures for Handling Ties In the sign lest...Ch. 13.2 - Finding Critical Values Table A-7 lists critical...Ch. 13.3 - Wilcoxon Signed-Ranks Test for Body Temperatures...Ch. 13.3 - Prob. 2BSCCh. 13.3 - Prob. 3BSCCh. 13.3 - Prob. 4BSCCh. 13.3 - Using the Wilcoxon Signed-Ranks Test. In Exercises...Ch. 13.3 - Using the Wilcoxon Signed-Ranks Test. In Exercises...Ch. 13.3 - Using the Wilcoxon Signed-Ranks Test. In Exercises...Ch. 13.3 - Using the Wilcoxon Signed-Ranks Test. In Exercises...Ch. 13.3 - Prob. 9BSCCh. 13.3 - Prob. 10BSCCh. 13.3 - Prob. 11BSCCh. 13.3 - Prob. 12BSCCh. 13.3 - Rank Sums Exercise 12 uses Data Set 23 Old...Ch. 13.4 - Prob. 1BSCCh. 13.4 - Rank Sum After ranking the combined list of...Ch. 13.4 - Prob. 3BSCCh. 13.4 - Prob. 4BSCCh. 13.4 - Wilcoxon Rank-Sum Test. In Exercises 58, use the...Ch. 13.4 - Wilcoxon Rank-Sum Test. In Exercises 58, use the...Ch. 13.4 - Wilcoxon Rank-Sum Test. In Exercises 58, use the...Ch. 13.4 - Wilcoxon Rank-Sum Test. In Exercises 58, use the...Ch. 13.4 - Prob. 9BSCCh. 13.4 - Appendix B Data Sets. In Exercises 912, refer to...Ch. 13.4 - Appendix B Data Sets. In Exercises 912, refer to...Ch. 13.4 - Appendix B Data Sets. In Exercises 912, refer to...Ch. 13.4 - Prob. 13BBCh. 13.4 - Finding Critical Values Assume that we have two...Ch. 13.5 - Prob. 1BSCCh. 13.5 - Requirements Assume that we want to use the data...Ch. 13.5 - Notation For the data given in Exercise 1,...Ch. 13.5 - Efficiency Refer to Table 13-2 on page 600 and...Ch. 13.5 - Prob. 5BSCCh. 13.5 - Prob. 6BSCCh. 13.5 - Prob. 7BSCCh. 13.5 - Prob. 8BSCCh. 13.5 - Appendix B Data Sets. In Exercises 912, use the...Ch. 13.5 - Prob. 10BSCCh. 13.5 - Appendix B Data Sets. In Exercises 912, use the...Ch. 13.5 - Appendix B Data Sets. In Exercises 912, use the...Ch. 13.5 - Correcting the H Test Statistic for Ties In using...Ch. 13.6 - Regression If the methods of this section are used...Ch. 13.6 - Level of Measurement Which of the levels of...Ch. 13.6 - Notation What do r, rs , and ps denote? Why is the...Ch. 13.6 - Prob. 4BSCCh. 13.6 - In Exercises 5 and 6, use the scatterplot to find...Ch. 13.6 - In Exercises 5 and 6, use the scatterplot to find...Ch. 13.6 - Testing for Rank Correlation. In Exercises 712,...Ch. 13.6 - Prob. 8BSCCh. 13.6 - Testing for Rank Correlation. In Exercises 712,...Ch. 13.6 - Testing for Rank Correlation. In Exercises 712,...Ch. 13.6 - Prob. 11BSCCh. 13.6 - Testing for Rank Correlation. In Exercises 712,...Ch. 13.6 - Prob. 13BSCCh. 13.6 - Appendix B Data Sets. In Exercises 1316, use the...Ch. 13.6 - Appendix B Data Sets. In Exercises 1316, use the...Ch. 13.6 - Prob. 16BSCCh. 13.6 - Prob. 17BBCh. 13.7 - In Exercises 14, use the following sequence of...Ch. 13.7 - Prob. 2BSCCh. 13.7 - Prob. 3BSCCh. 13.7 - Prob. 4BSCCh. 13.7 - Using the Runs Test for Randomness. In Exercises...Ch. 13.7 - Prob. 6BSCCh. 13.7 - Prob. 7BSCCh. 13.7 - Using the Runs Test for Randomness. In Exercises...Ch. 13.7 - Prob. 9BSCCh. 13.7 - Prob. 10BSCCh. 13.7 - Runs Test with Large Samples. In Exercises 912,...Ch. 13.7 - Prob. 12BSCCh. 13 - Prob. 1CQQCh. 13 - Prob. 2CQQCh. 13 - Prob. 3CQQCh. 13 - Prob. 4CQQCh. 13 - Prob. 5CQQCh. 13 - Prob. 6CQQCh. 13 - Prob. 7CQQCh. 13 - Prob. 8CQQCh. 13 - Prob. 9CQQCh. 13 - Which Test? Three different judges give the same...Ch. 13 - Prob. 1RECh. 13 - Using Nonparametric Tests. In Exercises 110, use a...Ch. 13 - Prob. 3RECh. 13 - Prob. 4RECh. 13 - Prob. 5RECh. 13 - Prob. 6RECh. 13 - Using Nonparametric Tests. In Exercises 110, use a...Ch. 13 - Prob. 8RECh. 13 - Using Nonparametric Tests. In Exercises 1-10, use...Ch. 13 - Prob. 10RECh. 13 - Prob. 1CRECh. 13 - Prob. 2CRECh. 13 - In Exercises 13, use the data listed below. The...Ch. 13 - Prob. 4CRECh. 13 - Prob. 5CRECh. 13 - Prob. 6CRECh. 13 - Prob. 7CRECh. 13 - Prob. 8CRECh. 13 - Fear of Heights Among readers of a USA Today...Ch. 13 - Cell Phones and Crashes: Analyzing Newspaper...Ch. 13 - Prob. 1TPCh. 13 - Prob. 1FDD
Knowledge Booster


Learn more about
Need a deep-dive on the concept behind this application? Look no further. Learn more about this topic, statistics and related others by exploring similar questions and additional content below.Similar questions
- Test stat: p value: Construct a confidence interval suitable for testing the claim that the two samples are from population with same mean ____<u1-u2<___arrow_forwardConduct an independent samples t-test (a.k.a., between-subjects design) comparing two independent groups on any variable of your choice. Each sample should have at least n=10 individuals (thus, 20 participants in the study total, at minimum) What to turn in: State your research question (e.g., Is there a difference in coffee consumption between males and females?). State the null and alternative hypotheses, and then conduct the hypothesis test using an alpha level of .05. Calculate and interpret a measure of effect size (estimated Cohen’s d or r2). Calculate a 95% confidence interval. Write a conclusion statement, as would appear in a published research report. Critical analysis: Write a short paragraph (2-3 sentences) explaining why your research question is important and where your findings could be applied. This is very open ended. For example, if one were studying coffee consumption differences between males and females, they could discuss the importance of this information for…arrow_forwardTEST THE APPROPRIATE HYPOTHESIS. Include the null and alternate hypotheses, degrees of freedom, teststatistic, rejection region, and decision You roll a die 48 times with the following results. Number 1 2 3 4 5 6 Frequency 4 13 2 14 13 2 Use a significance level of 0.05 to test the claim that the die is fair.arrow_forward
- Test the claim about the population mean, μ, at the given level of significance using the given sample statistics. Claim: μ≠6000; α=0.08; σ=391. Sample statistics: x=5900, n=49 Question content area bottom Part 1 Identify the null and alternative hypotheses. Choose the correct answer below. A. H0: μ≥6000 Ha: μ≠6000 B. H0: μ≠6000 Ha: μ=6000 C. H0: μ≠6000 Ha: μ≤6000 D. H0: μ=6000 Ha: μ≠6000 E. H0: μ≠6000 Ha: μ≥6000 F. H0: μ≤6000 Ha: μ≠6000arrow_forwardA severe storm has an average peak wave height of 16.4 feet for waves hitting the shore. Suppose that a storm is in progress with a severe storm class rating. Let us say that we want to set up a statistical test to see if the wave action (i.e., height) is dying down or getting worse. Suppose that you do not know if the storm is getting worse or dying out. You just want to test the hypothesis that the average wave height is different (either up or down) from the severe storm class rating. What would you use for the alternate hypothesis? Is the P-value area on the left, right, or on both sides of the mean?arrow_forwardDetermine the decision criterion for rejecting the null hypothesis in the given hypothesis test; i.e.,describe the values of the test statistic that would result in rejection of the null hypothesis. We wishto compare the means of two populations using paired observations. Suppose that d = 3.125, sd=2.911, and n = 8, and that you wish to test the following hypothesis at the 10% level of significance:H0: µd= 0 against H1: µd> 0.arrow_forward
- Sales team of a New Ventures Company is in the process of introducing a new product. As an initial step company conducted a survey of prospective customers. Estimate how large a sample should company take if they want to estimate the proportion of people who will buy the product to within 3%, with 99% confidence. A researcher has taken a random sample of 8 observation from a normal population. Sample mean and standard deviations are 75 and 50 respectively. Using the 6 steps process of hypothesis testing. Can he infer at the 10% significance level that the population mean is less than 100? Can he infer at the 10% significance level that the population mean is less than 100 if population standard deviation is 50? Review the answers in (i) and (ii) and explain why the test statistics differed.arrow_forwardTechnology. In Exercises 9–12, test the given claim by using the display provided from technology. Use a 0.05 significance level. Identify the null and alternative hypotheses, test statistic, P-value (or range of P-values), or critical value(s), and state the final conclusion that addresses the original claim. Body Temperatures Data Set 3 “Body Temperatures” in Appendix B includes 93 body temperatures measured at 12AM on day 1 of a study, and the accompanying XLSTAT display results from using those data to test the claim that the mean body temperature is equal to 98.6°F. Conduct the hypothesis test using these results. For Exercise 10arrow_forward1. After students understand how to derive and use Confidence Interval (CI) Estimation of single normal population and two normal populations, please explain the CI procedure to construct the lower and upper limits of the inequalities. Assume that you discover a new sampling distribution of two populations as a main given equation. 2. Assuming you have three groups of sample size data (n1=5, n2=10, and n3=15). How do you test for their equality of variances? Also explain the hypothesis testing procedure completely. 3. Most statistical software packages report the results in terms of P-values or Sig. extensively. What is the definition of Sig. and how do you use it in the interpretation? 4. Construct a scatter plot of your exemplified data from a given experiment. Does a simple linear regression model appear to be plausible? 4.1) In case Yes, use the statistical software to draw the diagram and fit the regression model. 4.2) In case No, how do you fit the model? and explain the method…arrow_forward
- Using the Kruskal-Wallis Test. In Exercises 5–8, use the Kruskal-Wallis test. Speed Dating Use the sample data from Exercise 1 to test the claim that females from the different age brackets give attribute ratings with the same median. Use a 0.05 significance level.arrow_forwardThe reliability of two types of machines used in the same manufacturing process is to be tested. The first machine failed to operate correctly in 90 out of 300 trials while the second type failed to operate correctly in 50 out of 250 trials. Carry out a hypothesis test to check whether there is a statistically significant difference in the reliability for the two types of machines using a 0.10 level of significance. (a) Calculate the pooled estimate of the population proportion. (b) Compute the value of the test statistic. (c) What is your conclusion? (multiple choice question) (A) There is a statistically significant difference in the reliability for the two types of machines. (B) It cannot be concluded that there is a statistically significant difference in the reliability for the two types of machines.arrow_forwardThe records of a state-owned company indicate that of all vehicles undergoing emissions testing during the previous year, 70% passed on the first test. A random sample of 200 cars tested in the country during the current year reveals that 62% passed the initial test. Does this data suggest that the true proportion for this country is less than the previous countrywide proportion? Test the relevant hypothesis at the 5% level of significance. (a) State the null and alternative hypotheses for the test. (b) What is the test statistic? (c) Calculate the value of the test statistic for this test. (d) Determine the critical region(s) for this test. (e) State the conclusion of this test. Give a reason for your answer.arrow_forward
arrow_back_ios
SEE MORE QUESTIONS
arrow_forward_ios
Recommended textbooks for you
 MATLAB: An Introduction with ApplicationsStatisticsISBN:9781119256830Author:Amos GilatPublisher:John Wiley & Sons Inc
 Probability and Statistics for Engineering and th...StatisticsISBN:9781305251809Author:Jay L. DevorePublisher:Cengage Learning
 Statistics for The Behavioral Sciences (MindTap C...StatisticsISBN:9781305504912Author:Frederick J Gravetter, Larry B. WallnauPublisher:Cengage Learning
 Elementary Statistics: Picturing the World (7th E...StatisticsISBN:9780134683416Author:Ron Larson, Betsy FarberPublisher:PEARSON
 The Basic Practice of StatisticsStatisticsISBN:9781319042578Author:David S. Moore, William I. Notz, Michael A. FlignerPublisher:W. H. Freeman
 Introduction to the Practice of StatisticsStatisticsISBN:9781319013387Author:David S. Moore, George P. McCabe, Bruce A. CraigPublisher:W. H. Freeman
MATLAB: An Introduction with Applications
Statistics
ISBN:9781119256830
Author:Amos Gilat
Publisher:John Wiley & Sons Inc
Probability and Statistics for Engineering and th...
Statistics
ISBN:9781305251809
Author:Jay L. Devore
Publisher:Cengage Learning
Statistics for The Behavioral Sciences (MindTap C...
Statistics
ISBN:9781305504912
Author:Frederick J Gravetter, Larry B. Wallnau
Publisher:Cengage Learning
Elementary Statistics: Picturing the World (7th E...
Statistics
ISBN:9780134683416
Author:Ron Larson, Betsy Farber
Publisher:PEARSON
The Basic Practice of Statistics
Statistics
ISBN:9781319042578
Author:David S. Moore, William I. Notz, Michael A. Fligner
Publisher:W. H. Freeman
Introduction to the Practice of Statistics
Statistics
ISBN:9781319013387
Author:David S. Moore, George P. McCabe, Bruce A. Craig
Publisher:W. H. Freeman
Hypothesis Testing using Confidence Interval Approach; Author: BUM2413 Applied Statistics UMP;https://www.youtube.com/watch?v=Hq1l3e9pLyY;License: Standard YouTube License, CC-BY
Hypothesis Testing - Difference of Two Means - Student's -Distribution & Normal Distribution; Author: The Organic Chemistry Tutor;https://www.youtube.com/watch?v=UcZwyzwWU7o;License: Standard Youtube License