
Concept explainers
Videos
In Exercises13.79-13.86, use either the critical-value approach or the P-value approach to perform a chi-square independence test, provided the conditions for using the test are met.
13.79 Siskel and Ebert In the classic TV show sneak previews, originally hosted by the late Gene Siskel and Roger Ebert the two Chicago movie critics reviewed the week’s new movie releases and then rated them thumbs up (positive), mixed or thumbs down (negative).These two critics often saw the merits of a movie differently. In general however were the ratings given by Siskel and Ebert associated?
The answer to this question was the focus of the paper “Evaluating agreement and Disagreement Among Movie Reviewers” by A.Agresti and L. Winner that appeared in chance (Vol. 10(2), pp.10-14).The following contingency table summarizes the ratings by Siskel and Ebert for 160 movies.
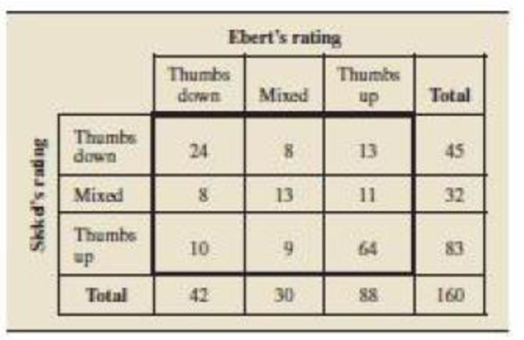
At the 1% significance level, do the data provide sufficient evidence to conclude that an association exists between the ratings of Siskel and Ebert?
Want to see the full answer?
Check out a sample textbook solution
Chapter 13 Solutions
Introductory Statistics (10th Edition)


- Technology. In Exercises 9–12, test the given claim by using the display provided from technology. Use a 0.05 significance level. Identify the null and alternative hypotheses, test statistic, P-value (or range of P-values), or critical value(s), and state the final conclusion that addresses the original claim. Airport Data Speeds Data Set 32 “Airport Data Speeds” in Appendix B includes Sprint data speeds (mbps). The accompanying TI-83/84 Plus display results from using those data to test the claim that they are from a population having a mean less than 4.00 Mbps. Conduct the hypothesis test using these results. For Exercise 9arrow_forwardIn Exercises 9.15–9.22, hypothesis tests are proposed. For eachhypothesis test, a. determine the null hypothesis. b. determine the alternative hypothesis. c. classify the hypothesis test as two tailed, left tailed, or right tailed. Body Temperature. A study by researchers at the University of Maryland addressed the question of whether the mean body tem-perature of humans is 98.6◦F. The results of the study by P. Mack-owiak et al. appeared in the article “A Critical Appraisal of 98.6◦F, the Upper Limit of the Normal Body Temperature, and Other Lega-cies of Carl Reinhold August Wunderlich” (Journal ofthe American Medical Association, Vol. 268, pp. 1578–1580). Among other data, the researchers obtained the body temperatures of93 healthy humans. Suppose that you want to use those data to decide whether the mean body temperature of healthy humans differs from 98.6◦Farrow_forwardWhat is the research hypothesis? a) The stress task will not lead to an increase in stress hormones. OR b) The stress task will lead to an increase in stress hormones.arrow_forward
- The following table shows the cross-classification of accounting practices (either straight line, declining balance, or both) and country (either France, Germany, or United Kingdom). France Germany United Kingdom Straight Line 20 11 30 Declining Balance 14 16 15 Both 15 23 13 Set up the competing hypotheses to determine if accounting practice and country are dependent. What is the degrees of freedom for the test. Calculate the value of the test statistic ( x2). Compute the p-value.arrow_forwardIn recent years, approximately 55% of eligible voters take the time to vote in presidential elections. A poll based on a random sample of 250 eligible voters finds that 112 plan to vote in the next presidential election. Does this data provide convincing evidence at the a=0.01 level that the proportion of eligible voters who will take time to vote in the next presidential election differs from 0.55? STATE: H₁: P. 0.55 H: 0.55 P where P- - the proportion of all eligible voters who will take the time to vote in the next presidential election. The evidence for His > 0.55 PLAN: Drag each statement from the answer bank to the appropriate box. True Statements Name of text: One-sample-test for p False Statements This is a random sample of 250 eligible voters. Name of text: Two-sample z text for p - P The Large Counts condition is met. Answer Bank (-) 113210 The random condition is not mat -13810 The Large Counts condition is not met. -11210 (A) 138210 (Enter 3 decimal places) z= (Round to…arrow_forward“The Rule of 40”, a principle according to which software company’s combined “Revenue growth rate” and “Operating margin” should exceed 40%, has gained momentum as a high-level gauge of performance for software businesses. Increasingly, executives are embracing “the Rule of 40” as an important metric for building company’s valuation. To investigate the relationship between the company’s fulfilment of the “Rule of 40” and the company’s market capitalization, quarterly data was gathered for a software company (Ansys) in Worksheet 1. Worksheet 1 Quarter ended date Rule of 40 (Revenue + Op Income, $M) Market Capitalization, $M Mar-03 $125 $424 Jun-03 $132 $514 Sep-03 $143 $597 Dec-03 $153 $596 Mar-04 $163 $581 Jun-04 $170 $666 Sep-04 $175 $957 Dec-04 $184 $1 073 Mar-05 $194 $1 091 Jun-05 $203 $1 196 Sep-05 $213 $1 341 Dec-05 $221 $1 567 Mar-06 $235 $2 177 Jun-06 $277 $1 915 Sep-06 $329 $1 956 Dec-06 $391 $1 976 Mar-07 $453 $2 120 Jun-07 $491…arrow_forward
- “The Rule of 40”, a principle according to which software company’s combined “Revenue growth rate” and “Operating margin” should exceed 40%, has gained momentum as a high-level gauge of performance for software businesses. Increasingly, executives are embracing “the Rule of 40” as an important metric for building company’s valuation. To investigate the relationship between the company’s fulfilment of the “Rule of 40” and the company’s market capitalization, quarterly data was gathered for a software company (Ansys) in Worksheet 1. Worksheet 1 Quarter ended date Rule of 40 (Revenue + Op Income, $M) Market Capitalization, $M Mar-03 $125 $424 Jun-03 $132 $514 Sep-03 $143 $597 Dec-03 $153 $596 Mar-04 $163 $581 Jun-04 $170 $666 Sep-04 $175 $957 Dec-04 $184 $1 073 Mar-05 $194 $1 091 Jun-05 $203 $1 196 Sep-05 $213 $1 341 Dec-05 $221 $1 567 Mar-06 $235 $2 177 Jun-06 $277 $1 915 Sep-06 $329 $1 956 Dec-06 $391 $1 976 Mar-07 $453 $2 120 Jun-07 $491…arrow_forwardAre you an impulse shopper? A survey of 600 grocery shoppers indicated that 57% of males and 44% of females make an impulse purchase every time they shop. Assume that the survey consisted of 300 males and 300females. a. At the 0.05level of significance, is there evidence of a difference in the proportion of males and females who make an impulse purchase every time they shop? b. Find the p-value and interpret its meaning.arrow_forwardIn Exercises 9.63–9.68, we have given the value obtained for the test statistic, z, in a one-mean z-test. We have also specified whether the test is two tailed, left tailed, or right tailed. Determine the P-value in each case and decide whether, at the 5% significance level, the data provide sufficient evidence to reject the null hypothesis in favor of the alternative hypothesis. 9.65 Left-tailed test: a. z =−0.74 b. z = 1.16arrow_forward
- In each of Exercises, use the technology of your choice to decide whether applying the t-test to perform a hypothesis test for the population mean in question appears reasonable. Explain your answers. Cardiovascular Hospitalizations. From the Florida State Center for Health Statistics report, Women and Cardiovascular Disease Hospitalizations, we found that, for cardiovascular hospitalizations, the mean age of women is 71.9 years. At one hospital, a random sample of 20 of its female cardiovascular patients had the following ages, in years. 75.9 83.7 87.3 74.5 82.5 78.2 76.1 52.8 56.4 53.8 88.2 78.9 81.7 54.4 52.7 58.9 97.6 65.8 86.4 72.4arrow_forwardThe following table shows the cross-classification of accounting practices (either straight line, declining balance, or both) and country (either France, Germany, or United Kingdom). France Germany United Kingdom Straight Line 20 11 30 Declining Balance 14 16 15 Both 15 23 13 a.Set up the competing hypotheses to determine if accounting practice and country are dependent. b.What is the degrees of freedom for the test. c.Calculate the value of the test statistic ( x2) d.Compute the p-value. e. Does the evidence suggest market capitalization and objective are dependent at the 1% significance level?arrow_forwardIn Exercises 5–18, test the given claim. Tennis Challenges The table below shows results since 2006 of challenged referee calls in the U.S. Open. Use a 0.05 significance level to test the claim that the gender of the tennis player is independent of whether the call is overturned. Do players of either gender appear to be better at challenging calls?arrow_forward
 Big Ideas Math A Bridge To Success Algebra 1: Stu...AlgebraISBN:9781680331141Author:HOUGHTON MIFFLIN HARCOURTPublisher:Houghton Mifflin Harcourt