
Videos
In Exercises 13.79-13.86, use either the critical-value approach or the P-value approach to perform a chi-square independence test, provided the conditions for using the test are met.
13.80 Diabetes in Native Americans. Preventable chronic diseases are increasing rapidly in Native American populations, particularly diabetes. F. Gilliland et al. examined the diabetes issue in the paper
“Preventative Health Care among Rural American Indians in New Mexico” (Preventive Medicine, Vol.28, pp. 194-202). Following is a contingency table showing cross-classification of educational attainment and diabetic state for a sample of 1273 Native Americans (HS is high school).
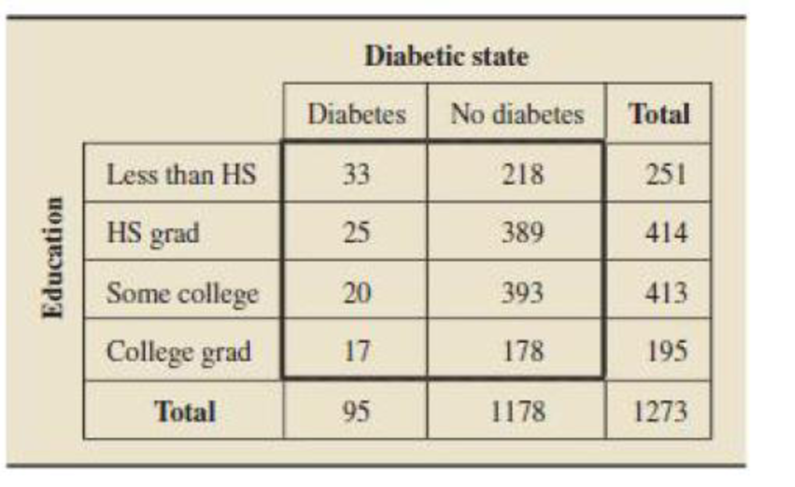
At the 1% significance level, do the data provide sufficient evidence to conclude that an association exists between educational level and diabetic state for Native Americans?
Want to see the full answer?
Check out a sample textbook solution
Chapter 13 Solutions
Introductory Statistics (10th Edition)


- 9 What particular aspects of the SPSS output would you look at to make your decision about the best model?arrow_forward2. Consider a study where students are measured on whether they had an internship during their time at WKU (Y/N) and whether they had a job at graduation (Y/N). If we wanted to test whether having an internship was associated with having a job at graduation (i.e., internship holders were more likely to have jobs), why would the chi-square test be inappropriate for this hypothesis? How should we analyze our data?arrow_forwardBased on the results presented, did the exercise intervention groups still receive a health benefit even if significant weight loss did not occur? Explain.arrow_forward
- Since its removal from the banned substances list in 2004 by the World Anti-Doping Agency,caffeine has been used by athletes with the expectancy that it enhances their workout andperformance. However, few studies look at the role caffeine plays in sedentary females.Researchers at the University of Western Australia conducted a test in which they determined therate of energy expenditure (kilojoules) on 10 healthy, sedentary females who were nonregularcaffeine users. Each female was randomly assigned either a placebo or caffeine pill (6mg/kg) 60minutes prior to exercise. The subject rode an exercise bike for 15 minutes at 65% of theirmaximum heart rate, and the energy expenditure was measured. The process was repeated on aseparate day for the remaining treatment. The mean difference in energy expenditure (caffeine –placebo) was 18kJ with a standard deviation of 19kJ. If we assume that the differences follow anormal distribution can it be concluded that that caffeine appears to increase…arrow_forwardAt the 5% significance level, does it appear that price of bus trips per week, population or average rate to park your personal vehicle can be removed from the model as unnecessary? In responding, construct and test any appropriate hypothesis.arrow_forwardIn Exercises 5–20, assume that the two samples are independent simple random samples selected from normally distributed populations, and do not assume that the population standard deviations are equal. (Note: Answers in Appendix D include technology answers based on Formula 9-1 along with “Table” answers based on Table A-3 with df equal to the smaller of n1 − 1 and n2 − 1.) IQ and Lead Exposure Data Set 7 “IQ and Lead” in Appendix B lists full IQ scores for a random sample of subjects with low lead levels in their blood and another random sample of subjects with high lead levels in their blood. The statistics are summarized below. a. Use a 0.05 significance level to test the claim that the mean IQ score of people with low blood lead levels is higher than the mean IQ score of people with high blood lead levels. b. Construct a confidence interval appropriate for the hypothesis test in part (a). c. Does exposure to lead appear to have an effect on IQ scores?arrow_forward
- An experiment was conducted to test whether students’ performance (above or below average) is independent of stress level as a result of pressure on time table for the term in Hwanhwan Senior High School. The table below gives a 3 × 2 contingency table of the sample. Above Average Average Below Average Total Stressed 135 250 285 670 Not Stressed 150 157 107 414 Total 285 407 392 1084 With the help of chi-square test statistics, determine whether students' performance for the selected term in the school is independent of their stressed level experienced from the time table at α = 0.05arrow_forwardIn Exercises 13–20, determine whether the data are from a discrete or continuous data set. CHIS Among the subjects surveyed as part of the California Health Interview Survey (CHIS), several subjects are randomly selected and their heights are recorded.arrow_forwardWhat us the t stat? And the p value? And what do results confirm?arrow_forward
- The dataset below was collected from a survey to determine whether CFT development in the island can be used as a strategy for the sustainable management and utilization of the fishery and aquatic resources in small islands. It shows the monthly income (in thousand pesos) estimated by 200 randomly selected fishers in Guimaras according to the type of fishers (i.e., the income source of fishers is solely fishing or they have alternative/supplemental livelihood such as island hopping services, sari-sari store ownership, fish value adding and/or vending, souvenir selling, carpentry, as construction worker, farming and tour guiding) and their perceived benefit from CFT development in the island. From this dataset and using = 0.05, is there a significant difference in estimated monthly income due tofisher type? How about due to the CFT perceived benefit? How about due to the interaction between fishertype and the perceived CFT benefit?a. Analyze manually and assume that the…arrow_forwardIn Exercises 5–16, use analysis of variance for the indicated test. In Exercises 15 and 16, use the data set in Appendix B. Chocolate Chip Cookies Refer to Data Set 28 “Chocolate Chip Cookies” in Appendix B and use the counts of chocolate chips from the three different types of Chips Ahoy cookies. Use a 0.05 significance level to test the claim that the three different types of Chips Ahoy cookies have the same mean number of chocolate chips. Do the reduced fat Chips Ahoy cookies appear to have fewer chocolate chips?arrow_forwardA university interested in tracking its honors program believes that the proportion of graduates with a GPA of 3.00 or below is less than 0.20. In a sample of 200 graduates, 30 students have a GPA of 3.00 or below. In testing the university’s belief, how does one define the population parameter of interest?arrow_forward
 MATLAB: An Introduction with ApplicationsStatisticsISBN:9781119256830Author:Amos GilatPublisher:John Wiley & Sons Inc
 Probability and Statistics for Engineering and th...StatisticsISBN:9781305251809Author:Jay L. DevorePublisher:Cengage Learning
 Statistics for The Behavioral Sciences (MindTap C...StatisticsISBN:9781305504912Author:Frederick J Gravetter, Larry B. WallnauPublisher:Cengage Learning
 Elementary Statistics: Picturing the World (7th E...StatisticsISBN:9780134683416Author:Ron Larson, Betsy FarberPublisher:PEARSON
 The Basic Practice of StatisticsStatisticsISBN:9781319042578Author:David S. Moore, William I. Notz, Michael A. FlignerPublisher:W. H. Freeman
 Introduction to the Practice of StatisticsStatisticsISBN:9781319013387Author:David S. Moore, George P. McCabe, Bruce A. CraigPublisher:W. H. Freeman