
Videos
Wilcoxon Rank-Sum Test. In Exercises 5–8, use the Wilcoxon rank-sum test.
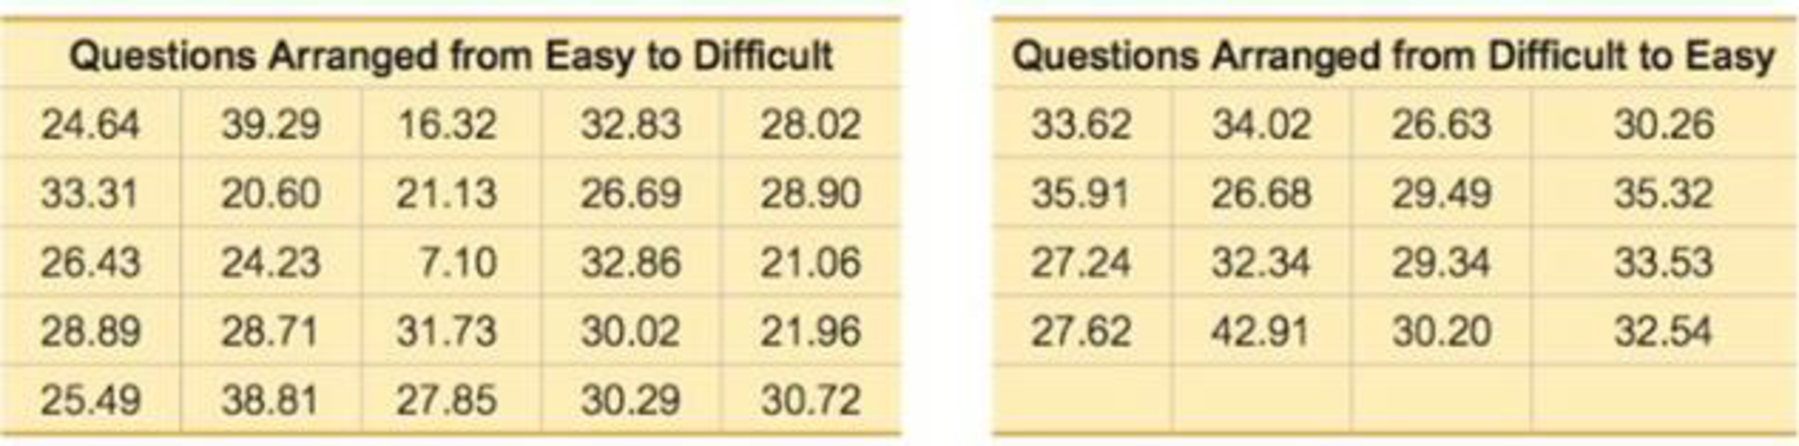
8. Blanking Out on Tests In a study of students blanking out on tests, the arrangement of test items was studied for its effect on anxiety. The following scores are measures of “debilitating test anxiety” (based on data from “Item Arrangement, Cognitive Entry Characteristics, Sex and Test Anxiety as Predictors of Achievement in Examination Performance,” by Klimko, Journal of Experimental Education, Vol. 52, No. 4.) Is there sufficient evidence to support the claim that the two samples are from populations with different medians? Is there sufficient evidence to support the claim that the arrangement of the test items has an effect on the score? Use a 0.01 significance level.
Want to see the full answer?
Check out a sample textbook solution
Chapter 13 Solutions
EBK ELEMENTARY STATISTICS


- Healing A medical researcher suspects that giving post-surgical patients large doses of vitamin E will speed their recovery times by helping their incisions heal morequickly. Design an experiment to test this conjecture. Besure to identify the factors, levels, treatments, responsevariable, and the role of randomization.arrow_forwardDoes ginkgo improve memory? The law allows marketers of herbs and other natural substances to make health claims that are not supported by evidence. Brands of ginkgo extract claim to “improve memory and concentration.” A randomized comparative experiment found no statistically significant evidence for such effects. The subjects were 350 healthy volunteers over 60 years old. They were randomly assigned to ginkgo or a placebo pill (a dummy pill that looks and tastes the same). All the subjects took a battery of tests for learning and memory before treatment started and again after six weeks. (a) The study was double-blind. Why is this important? (b) Can the results of this study be generalized to a larger population? Can cause-and-effect be inferred? Explain. (c) Explain why it is advantageous to use 350 volunteers in this study, rather than, say, 30.arrow_forward3. A shoe manufacturer wants to decide demand for big size shoes for men. It has been claimed that 19% of Ontario men are with big size feet. Recently the manufacturer conducted a survey on a random sample of 250 Ontario men, and found that 43 of them are with big feet. Does this data provides evidence to suggest that the percentage of men with big feet has decreased ? Use 4% signficance level. The rejection region for this test is: Z <= -1.751 -2.054 <= Z <= 2.054 -1.751 <= Z <= 1.751 Z >=1.751arrow_forward
- Ad recall In Exercises 27 and 29, we see the number ofadvertised brand names people recalled immediately afterwatching TV shows and 24 hours later. Strangely enough,it appears that they remembered more about the ads thenext day. Should we conclude this is true in general aboutpeople’s memory of TV ads? a) Suppose one analyst conducts a two-sample hypoth-esis test to see if memory of brands advertised dur-ing violent TV shows is higher 24 hours later. If his P-value is 0.00013, what might he conclude?b) Explain why his procedure was inappropriate. Whichof the assumptions for inference was violated?c) How might the design of this experiment have taintedthe results? d) Suggest a design that could compare immediate brand-name recall with recall one day later.arrow_forwardNonparametric: A small study is conducted to compare birth weight in babies born to different groups of mothers based on their smoking status (nonsmokers, ex-smokers, light smokers, and heavy smokers). Is there a significant difference between birth weights due to maternal smoking status? Use the Kruskal Wallis test with a 5% level of significance. What is R2 (Group 2)? Birth weights of infants in four groups of mothers. (Observed data) Group 1 (Nonsmokers) Group 2 (Ex-smokers) Group 3 (<1/2 pack/day) Group 4 (≥1/2 pack/day) 8.6 7.4 6.0 7.0 8.5 8.6 6.8 5.2 6.3 8.5 7.3 6.1 9.3 5.4 5.7 6.7 8.0 9.2 8.7 6.6 6.8 6.3 7.4 4.9 6.3arrow_forwardIn a study of high school students at least 16 years of age, researches obtained data summarized in the table below. Test the claim that texting while driving is independent of drinking alchohol and driving. Assume a significance level of 0.05. Drove when Drinking Did not drive when Drinking Totals Texting while Driving 731 3054 3785 No Texting and Driving 156 4564 4720 Totals 887 7618 8505 f) What is the value of the test statistic? χ2= g) What is the decision? h) What is the conclusion?arrow_forward
- Age discrimination: The following table presents the numbers of employees, by age group, who were promoted, or not promoted, in a sample drawn from a certain industry during the past year. Age Under 30 30 - 39 40 - 49 50 and Over Promoted 12 30 16 14 Not Promoted 46 38 39 40 Can you conclude that the people in some age groups are more likely to be promoted than those in other age groups? Use the =α0.05 level of significance and the P-value method with the TI-84 Plus calculator. find p valuearrow_forwardPolling How accurate are pollsters in predicting theoutcomes of congressional elections? The table shows theactual number of Democratic party seats in the House ofRepresentatives and the number predicted by the Galluporganization for nonpresidential election years betweenWorld War II and 1998.a) Is there a significant difference between the numberof seats predicted for the Democrats and the numberthey actually held? Test an appropriate hypothesisand state your conclusions.b) Is there a strong association between the pollsters’predictions and the outcomes of the elections?Test an appropriate hypothesis and state yourconclusions. Democratic Party CongressmenYear Predicted Actual1946 190 1881950 235 2341954 232 2321958 272 2831962 259 2581966 247 2481970 260 2551974 292 2911978 277 2771982 275 2691986 264 2581990 260 2671994 201 2041998 211 211arrow_forwardA researcher is interested in ascertaining whether performance on an aptitude test is significantly related to performance on the job. He obtained an aptitude test score of 50 new employees as well as their job performance ratings from their supervisors. He, however, suspects that some of the supervisors were biased in their ratings into ranks. what statistical test should be used to test the research hypothesis? Expain your answer.arrow_forward
- Sex sells, part II In Exercise 11 you considered the ques-tion of whether sexual images in ads affected people’s abilities to remember the item being advertised. To inves-tigate, a group of Statistics students cut ads out of maga-zines. They were careful to find two ads for each of 10 similar items, one with a sexual image and one with-out. They arranged the ads in random order and had 39 subjects look at them for one minute. Then they askedthe subjects to list as many of the products as they couldremember. Their data are shown in the table. Is thereevidence that the sexual images mattered? SubjectNumberAds Remembered SubjectNumberAds RememberedSexual Image No Sex Sexual Image No Sex1 2 2 21 2 32 6 7 22 4 23 3 1 23 3 34 6 5 24 5 35 1 0 25 4 56 3 3 26 2 47 3 5 27 2 28 7 4 28 2 49 3 7 29 7 610 5 4 30 6 711 1 3 31 4 312 3 2 32 4 513 6 3 33 3 014 7 4 34 4 315 3 2 35 2 316 7 4 36 3 317 4 4 37 5 518 1 3 38 3 419 5 5 39 4 320 2 2arrow_forwardApplying the Concepts and SkillsLosses to Robbery. The Federal Bureau of Investigation conducts surveys to obtain information on the value of losses from various types of robberies. Results of the surveys are published in Population-at-Risk Rates and Selected Crime Indicators. Independentsimple random samples of reports for three types of robberies— highway, gas station, and convenience store—gave the following data, in dollars, on value of losses. Highway Gasstation Conveniencetore 952 1298 844 996 1195 921 839 1174 880 1088 1113 706 1024 953 602 1280 614 a. What does MSTR measure?b. What does MSE measure?c. Suppose that you want to perform a one-way ANOVA to compare the mean losses among the three types of robberies. What conditions are necessary? How crucial are those conditions?arrow_forwardAre you an impulse shopper? A survey of 800 grocery shoppers indicated that 48% of males and 37% of females make an impulse purchase every time they shop. Assume that the survey consisted of 400 males and 400 females. a. At the 0.01 level of significance, is there evidence of a difference in the proportion of males and females who make an impulse purchase every time they shop? b. Find the p-value and interpret its meaning. Question content area bottom Part 1 a. State the null and alternative hypotheses, where π1 is the population proportion of males who make an impulse purchase every time they shop and π2 is the population proportion of females who make an impulse purchase every time they shop. Choose the correct answer below. A. H0: π1=π2 H1: π1>π2 B. H0: π1≠π2 H1: π1=π2 C. H0: π1≠π2 H1: π1>π2 D. H0: π1≠π2 H1: π1<π2 E. H0: π1=π2 H1: π1<π2 F. H0: π1=π2 H1: π1≠π2 Your answer is correct.…arrow_forward
 MATLAB: An Introduction with ApplicationsStatisticsISBN:9781119256830Author:Amos GilatPublisher:John Wiley & Sons Inc
 Probability and Statistics for Engineering and th...StatisticsISBN:9781305251809Author:Jay L. DevorePublisher:Cengage Learning
 Statistics for The Behavioral Sciences (MindTap C...StatisticsISBN:9781305504912Author:Frederick J Gravetter, Larry B. WallnauPublisher:Cengage Learning
 Elementary Statistics: Picturing the World (7th E...StatisticsISBN:9780134683416Author:Ron Larson, Betsy FarberPublisher:PEARSON
 The Basic Practice of StatisticsStatisticsISBN:9781319042578Author:David S. Moore, William I. Notz, Michael A. FlignerPublisher:W. H. Freeman
 Introduction to the Practice of StatisticsStatisticsISBN:9781319013387Author:David S. Moore, George P. McCabe, Bruce A. CraigPublisher:W. H. Freeman