
Statistics for Business and Economics (13th Edition)
13th Edition
ISBN: 9780134648385
Author: MCCLAVE
Publisher: PEARSON
expand_more
expand_more
format_list_bulleted
Concept explainers
Videos
Textbook Question
Chapter 13.5, Problem 13.29ACB
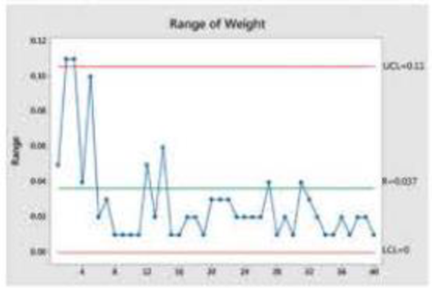
Weight of packed frozen scallops. In Quality Engineering (Vol. 28, No. 3, 2016), control charts were used to monitor the weight of frozen scallops packed at a marine products plant. During packing, the scallops are placed In plastic trays. The target total weight (scallops and plastic trays) is 2 kilograms. To monitor the packing process, the quality control department takes 5 samples of 5 plastic trays In the overnight shift every day and records the weight of each tray. An R-chart of weight for the first 40 samples is shown to the right.
- a. Identify the rational subgroups used to construct the R-chart.
- b. Is the process in control? If not, what do you recommend?
Expert Solution & Answer
Want to see the full answer?
Check out a sample textbook solution
Students have asked these similar questions
the soil biogeochemistry in Californian salt marshes wished to explore how two of the most common plant species, pickleweed and pacific cordgrass, affected the accumulation of nitrogen in the soil. They measured the concentration of ammonium, a molecular form of organic nitrogen, in the soil, and measured or manipulated the density of pickleweed and cordgrass. Manipulations of ½ meter square plots (20 plots per manipulation) included removing all cordgrass (cordgrass removal), removing all pickleweed (pickleweed removal), or mixed (the control - nothing removed, thus mixed plots included a mixture of natural pickleweed and cordgrass). Boxplots of ammonium concentrations in each of the three manipulation treatments.
Letters indicate differences among means as determined by a Tukey posthoc test following
ANOVA. (b) Overall relationship between cordgrass stem density and soil ammonium content (includes data from all plot treatments). The solid black line and the gray shading represent the…
A pharmaceutical company states that there is 500mg of active ingredient in each capsule for one of the medicines they manufacture. However, the FDA believes the company is purposely underfilling the capsule to save money. A sample of 20 capsules is taken and the amount of active ingredient inside is measured. The results are below:
484
460
471
512
494
529
494
485
474
502
503
538
466
495
475
529
518
464
449
489
Part 1: Construct a 95% confidence interval using toolPAK for the amount of active ingredient measured. Use the appropriate distribution, and specify the upper and lower limits of the interval.
Part 2: Carefully interpret the 95% confidence interval? What if you did constructed a Confidence Interval Manually?
Part 3: Does the 95% confidence interval support the FDA’s claim? Explain.
Part 4: Would your answer change if the confidence level was lowered to 75%? Explain.
The performance of two analysts in determining total mercury (mg / kg) in fish was evaluated using the absorption spectrometry method. The results on the concentrations of mercury found in fish, for each analyst, are presented in the table below:
Analyst 1
Analyst 2
7
12
9
8
6
9
11
13
13
14
8
9
7
8
13
10
12
7
9
15
(a)Is the performance in determining total mercury for Analyst 1 more accurate than Analyst 2? Compare the accuracy in the results of the two analysts at a 95% confidence level. Explain.
(b)Are the results obtained by the two analysts, in the concentrations of mercury found in the fish, statistically equivalent, with 95% confidence? Explain
Chapter 13 Solutions
Statistics for Business and Economics (13th Edition)
Ch. 13.4 - What is a control chart? Describe its use.Ch. 13.4 - Explain why rational subgrouping should be used in...Ch. 13.4 - When a control chart is first constructed, why are...Ch. 13.4 - Which process parameter is an x -chart used to...Ch. 13.4 - Even if all the points on an x -chart fall between...Ch. 13.4 - What must be true about the variation of a process...Ch. 13.4 - Use the six pattern-analysis rules described in...Ch. 13.4 - Consider the x -chart shown below. a. Is the...Ch. 13.4 - Use Table IX on page 13-74 to find the value of A2...Ch. 13.4 - Twenty-five consecutive samples of size n = 5 were...
Ch. 13.4 - The data in the following table were collected for...Ch. 13.4 - Prob. 13.12ACBCh. 13.4 - Active pharmaceutical ingredient. During the...Ch. 13.4 - Detecting gender-related employment disparities....Ch. 13.4 - Pain levels of ICU patients. Various interventions...Ch. 13.4 - Quality control for irrigation data. Most farmers...Ch. 13.4 - Improving public health waiting times. Statistical...Ch. 13.4 - Cereal box manufacturing. A machine at K-Company...Ch. 13.4 - Detecting under-reported emissions. The...Ch. 13.4 - 13 20 Selecting the best wafer-slicing machine....Ch. 13.4 - Chunky data. BPI Consulting, a leading provider of...Ch. 13.4 - Military aircraft bolts. A precision parts...Ch. 13.5 - What characteristic of a process is an R-chart...Ch. 13.5 - Prob. 13.24LMCh. 13.5 - Use Table IX on page 13-74 to find the values of...Ch. 13.5 - Construct and interpret an R-chart for the data in...Ch. 13.5 - Construct and interpret an R-chart for the data in...Ch. 13.5 - Construct and interpret an R-chart and an x -chart...Ch. 13.5 - Weight of packed frozen scallops. In Quality...Ch. 13.5 - Detecting gender-related employment disparities....Ch. 13.5 - Pain levels of ICU patients. Refer to the Research...Ch. 13.5 - Quality control for irrigation data. Refer to...Ch. 13.5 - Lowering the thickness of an expensive blow-molded...Ch. 13.5 - Cola bottle filling process. A soft-drink bottling...Ch. 13.5 - Chunky data. Refer to Exercise 13.21e (p. 13-40)...Ch. 13.5 - Replacement times for lost ATM cards. In an effort...Ch. 13.5 - Military aircraft bolts. Refer to the...Ch. 13.5 - Precision of scale weight measurements. The...Ch. 13.6 - What characteristic of a process is a p-chart...Ch. 13.6 - In each of the following cases, use the sample...Ch. 13.6 - The proportion of defective items generated by a...Ch. 13.6 - To construct a p-chart for a manufacturing...Ch. 13.6 - To construct a p-chart, 20 samples of size 150...Ch. 13.6 - Academic failure rates in Nigeria. The quality...Ch. 13.6 - Monitoring surgery complications. An article on...Ch. 13.6 - Rental car call center study. A worldwide rental...Ch. 13.6 - Defective micron chips. A manufacturer produces...Ch. 13.6 - Hand break cable defects. In Control Engineering...Ch. 13.6 - Monitoring newspaper typesetters. Accurate...Ch. 13.6 - Quality of rewritable CDs. A Japanese compact disc...Ch. 13.6 - Leaky process pumps. Quality (February 2008)...Ch. 13.6 - Rubber company lire tests. Goodstone Tire Rubber...Ch. 13.7 - Explain why it is inappropriate to conduct a...Ch. 13.7 - Explain the difference between process spread and...Ch. 13.7 - Describe two different ways to assess the...Ch. 13.7 - Why is it recommended to use and interpret Cp in...Ch. 13.7 - For a process that is in control and follows a...Ch. 13.7 - Find the specification spread for each of the...Ch. 13.7 - Find (or estimate) the process spread for each of...Ch. 13.7 - Find the value of Cp for each of the following...Ch. 13.7 - Upper specification limit of a process. An...Ch. 13.7 - Capability of an in-control process. A process is...Ch. 13.7 - Water use at a thermal power plant. Thermal power...Ch. 13.7 - Cereal box filling process. Refer to the data on...Ch. 13.7 - Military aircraft bolts. Refer to Exercise 13.22...Ch. 13.7 - Bioreactor production of antibodies. Benchtop...Ch. 13.7 - Driver gear bore holes. During the manufacture of...Ch. 13.7 - Lowering the thickness of an expensive blow-molded...Ch. 13 - Define quality and list its important dimensions.Ch. 13 - What is a process? Give an example of an...Ch. 13 - What is a system? Give an example of a system with...Ch. 13 - Describe the six major sources of process...Ch. 13 - Suppose all the output of a process over the last...Ch. 13 - Processes that are in control are predictable;...Ch. 13 - Compare and contrast special and common causes...Ch. 13 - Explain the difference between control limits and...Ch. 13 - Should control charts be used to monitor a process...Ch. 13 - Under what circumstances is it appropriate to use...Ch. 13 - A process is under control and follows a normal...Ch. 13 - Weight of a product. Consider the time series data...Ch. 13 - Lengths of pencils. The length measurements of 20...Ch. 13 - Applying pattern-analysis rules. Use the...Ch. 13 - Defective plastic mold. A company that...Ch. 13 - Robotics clamp gap width. Control chart...Ch. 13 - Package sorting time. AirExpress. an overnight...Ch. 13 - Waiting times of airline passengers. Officials at...Ch. 13 - Defects in graphite shafts. Over the last year, a...Ch. 13 - New iron-making process. Mining Engineering...Ch. 13 - CPU of a computer chip. The central processing...Ch. 13 - Bayfield Mud Company case. The text Quantitative...
Knowledge Booster


Learn more about
Need a deep-dive on the concept behind this application? Look no further. Learn more about this topic, statistics and related others by exploring similar questions and additional content below.Similar questions
- Cholesterol Cholesterol in human blood is necessary, but too much can lead to health problems. There are three main types of cholesterol: HDL (high-density lipoproteins), LDL (low-density lipoproteins), and VLDL (very low-density lipoproteins). HDL is considered “good” cholesterol; LDL and VLDL are considered “bad” cholesterol. A standard fasting cholesterol blood test measures total cholesterol, HDL cholesterol, and triglycerides. These numbers are used to estimate LDL and VLDL, which are difficult to measure directly. Your doctor recommends that your combined LDL/VLDL cholesterol level be less than 130 milligrams per deciliter, your HDL cholesterol level be at least 60 milligrams per deciliter, and your total cholesterol level be no more than 200 milligrams per deciliter. (a) Write a system of linear inequalities for the recommended cholesterol levels. Let x represent the HDL cholesterol level, and let y represent the combined LDL VLDL cholesterol level. (b) Graph the system of inequalities from part (a). Label any vertices of the solution region. (c) Is the following set of cholesterol levels within the recommendations? Explain. LDL/VLDL: 120 milligrams per deciliter HDL: 90 milligrams per deciliter Total: 210 milligrams per deciliter (d) Give an example of cholesterol levels in which the LDL/VLDL cholesterol level is too high but the HDL cholesterol level is acceptable. (e) Another recommendation is that the ratio of total cholesterol to HDL cholesterol be less than 4 (that is, less than 4 to 1). Identify a point in the solution region from part (b) that meets this recommendation, and explain why it meets the recommendation.arrow_forwardIn a study conducted to examine the quality of fish after 7 days in ice storage, ten raw fish of the same kind and approximately the same size were caught and prepared for ice storage. The fish were placed in ice storage at different times after being caught. A measure of fish quality was given to each fish after 7 days in ice storage. The sample data are shown below, where "Time" is the number of hours after being caught that the fish was placed in ice storage and "Fish Quality" is the measure given to each fish after 7 days in ice storage (higher numbers mean better quality). Which variable would be considered the response variable? Fish Time: 0 0 2 3 5 6 7 9 11 12 Fish Quality 8.5 8.4 8.0 8.1 7.8 7.6 7.3 7.0 6.8 6.7 Choose the correct answer below. A.Fish Quality B.Time C.Neither variable could be considered a response variable.arrow_forwardIn a study to estimate the proportion of smokers among the residents in a certain city and its suburbs, it is found that 24 of 104 urban residents aresmokers, while 34 of 108 suburban residents are smokers. Is there a significant difference between the proportions of smokers among urban and suburban residents? Make use of a P-value.arrow_forward
- A study reported in the Journal of the American Medical Association investigated the cardiac demands of heavy snow shoveling. Ten healthy men underwent exercise testing with a treadmill and a cycle ergometer modified for arm cranking. The men then cleared two tracts of heavy, wet snow by using a lightweight plastic snow shovel and an electric snow thrower. Each subject’s heart rate, blood pressure, oxygen uptake, and perceived exertion during snow removal were compared with the values obtained during treadmill and arm-crank ergometer testing. Suppose the following table gives the heart rates in beats per minute for each of the 10 subjects. alpha = .05 what is the p-value?arrow_forwardA study reported in the Journal of the American Medical Association investigated the cardiac demands of heavy snow shoveling. Ten healthy men underwent exercise testing with a treadmill and a cycle ergometer modified for arm cranking. The men then cleared two tracts of heavy, wet snow by using a lightweight plastic snow shovel and an electric snow thrower. Each subject's heart rate, blood pressure, oxygen uptake, and perceived exertion during snow removal were compared with the values obtained during treadmill and arm-crank ergometer testing. Suppose the following table gives the heart rates in beats per minute for each of the 10 subjects. Treadmill Arm-Crank Ergometer Snow Shovel Snow Thrower 177 205 180 98 151 177 164 120 184 166 167 111 161 152 173 122 192 142 179 151 193 172 205 158 164 191 156 117 207 170 160 123 177 181 175 127 174 154 191 109 At the .05 level of significance, test for any significant differences. Complete the following table (to 2…arrow_forwardAt a research facility that designs rocket engines, researchers know that some engines fail to ignite as a result of fuel system error. From a random sample of 40 engines of one design, 14 failed to ignite as a result of fuel system error. From a random sample of 30 engines of a second design, 9 failed to ignite as a result of fuel system error. The researchers want to estimate the difference in the proportion of engine failures for the two designs. Which of the following is the most appropriate method to create the estimate? A one-sample zz-interval for a sample proportion A A one-sample zz-interval for a population proportion B A two-sample zz-interval for a population proportion C A two-sample zz-interval for a difference in sample proportions D A two-sample zz-interval for a difference in population proportionsarrow_forward
- Reducing scrap of 4-foot planks of hardwood is an important factor in reducing cost at a wood-flooring manufacturing company. Accordingly, engineers at Lumberworks are investigating a potential new cutting method involving lateral sawing that may reduce the scrap rate. To examine its viability, samples of 600 and 500 planks, respectively, were examined under the old and new methods. Sixty-one of the 600 planks were scrapped under the old method, whereas 36 of the 500 planks were scrapped under the new method. (You may find it useful to reference the appropriate table: z table or t table)a. Construct the 99% confidence interval for the difference between the population scrap rates between the old and new methods, respectively. (Negative values should be indicated by a minus sign. Round intermediate calculations to at least 4 decimal places and final answers to 2 decimal places.)arrow_forwardAfter receiving complaints from McDonald’s customers in Japan about the amount offrench fries being served, the on-line news magazine ”Rocket News” decided to testthe actual weight of the fries served at a particular Japanese McDonald’s restaurant.According to the Rocket News article, the official weight standard set by McDonald’s ofJapan is for a medium sized fries to weigh 135 grams. The publication weighed the friesfrom 36 different medium fries they purchased and found the average weight of the friesin their sample to be 130 grams with a variance of 225 grams. Research Question: Doesthe data suggest that the medium fries from this McDonald’s in Japan are underpacked?Useα=0.05. (a) Which of the following is theH0? (null) A.H0:μ6=135 B.H0:x6=135 C.H0:μ≥130 D.H0:x≥130 E.H0:μ≤135 F.H0:x≤135 G.H0:μ≥135 H.H0:x≥135 I. None of these (b) Which of the following is the correct formula to compute Test Statistic (TS)?A.135−13015/√36B.130−13515/√36C.135−130225/√36D.130−135225/√36E. None of these…arrow_forwardBrunt, Rhee, and Zhong (2008) surveyed 557 undergraduate college students to examine their weight status, health behaviors, and diet. Using body mass index (BMI), they classified the students into four categories: underweight, healthy weight, overweight, and obese. They also measured dietary variety by counting the number of different foods each student ate from several food groups. Note that the researchers are not measuring the amount of food eaten but rather the number of different foods eaten (variety, not quantity). Nonetheless, it was somewhat surprising that the results showed no differences among the four weight categories that were related to eating fatty and/ or sugary snacks. Suppose a researcher conducting a follow up study obtains a sample of n = 25 students classified as healthy weight and a sample of n = 36 students classified as overweight. Each student completes the food variety questionnaire, and the healthy-weight group produces a mean of M = 4.01 for the fatty,…arrow_forward
- Brunt, Rhee, and Zhong (2008) surveyed 557 undergraduate college students to examine their weight status, health behaviors, and diet. Using body mass index (BMI), they classified the students into four categories: underweight, healthy weight, overweight, and obese. They also measured dietary variety by counting the number of different foods each student ate from several food groups. Note that the researchers are not measuring the amount of food eaten but rather the number of different foods eaten (variety, not quantity). Nonetheless, it was somewhat surprising that the results showed no differences among the four weight categories that were related to eating fatty and/ or sugary snacks. Suppose a researcher conducting a follow up study obtains a sample of n = 25 students classified as healthy weight and a sample of n = 36 students classified as overweight. Each student completes the food variety questionnaire, and the healthy-weight group produces a mean of M = 4.01 for the fatty,…arrow_forwardBrunt, Rhee, and Zhong (2008) surveyed 557 undergraduate college students to examine their weight status, health behaviors, and diet. Using body mass index (BMI), they classified the students into four categories: underweight, healthy weight, overweight, and obese. They also measured dietary variety by counting the number of different foods each student ate from several food groups. Note that the researchers are not measuring the amount of food eaten but rather the number of different foods eaten (variety, not quantity). Nonetheless, it was somewhat surprising that the results showed no differences among the four weight categories that were related to eating fatty and/ or sugary snacks. Suppose a researcher conducting a follow up study obtains a sample of n = 25 students classified as healthy weight and a sample of n = 36 students classified as overweight. Each student completes the food variety questionnaire, and the healthy-weight group produces a mean of M = 4.01 for the fatty,…arrow_forward
arrow_back_ios
arrow_forward_ios
Recommended textbooks for you

 Linear Algebra: A Modern IntroductionAlgebraISBN:9781285463247Author:David PoolePublisher:Cengage Learning
 Glencoe Algebra 1, Student Edition, 9780079039897...AlgebraISBN:9780079039897Author:CarterPublisher:McGraw Hill
Linear Algebra: A Modern Introduction
Algebra
ISBN:9781285463247
Author:David Poole
Publisher:Cengage Learning
Glencoe Algebra 1, Student Edition, 9780079039897...
Algebra
ISBN:9780079039897
Author:Carter
Publisher:McGraw Hill
Sampling Methods and Bias with Surveys: Crash Course Statistics #10; Author: CrashCourse;https://www.youtube.com/watch?v=Rf-fIpB4D50;License: Standard YouTube License, CC-BY
Statistics: Sampling Methods; Author: Mathispower4u;https://www.youtube.com/watch?v=s6ApdTvgvOs;License: Standard YouTube License, CC-BY