
Videos
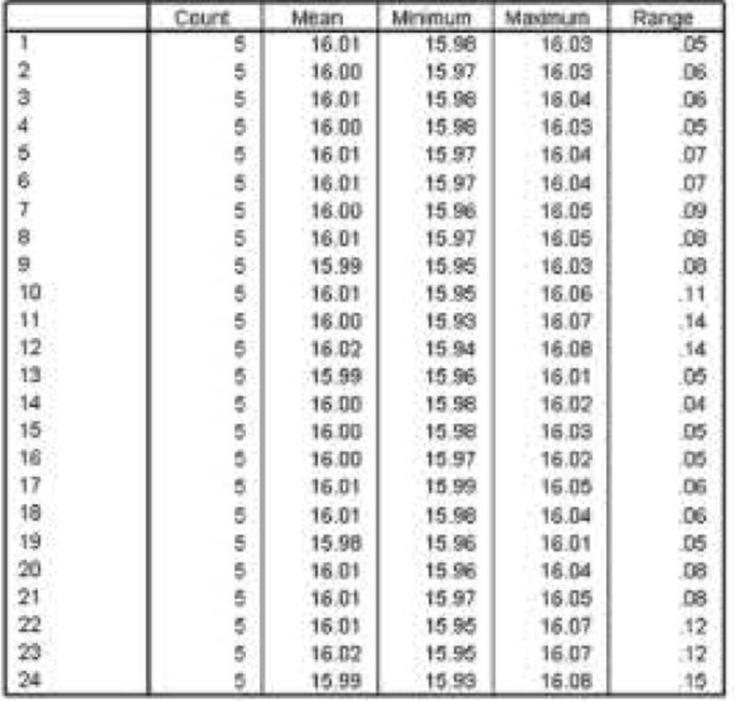
Cola bottle filling process. A soft-drink bottling company is interested in monitoring the amount of cola injected into 16-ounce bottles by a particular filling head. The process is entirely automated and operates 24 hours a day. At 6:00 a.m. and 6:00 p.m. each day, a new dispenser of carbon dioxide capable of producing 20,000 gallons of cola is hooked up to the filling machine. To monitor the process using control charts, the company decided to sample five consecutive bottles of cola each hour beginning at 6:15 a.m. (i.e.. 6:15 a.m., 7:15 a.m., 8:15 a.m., etc.). The data for the first day are saved in the file. An SPSS
- a. Will the rational subgrouping strategy that was used enable the company to detect variation in fill caused by differences in the carbon dioxide dispensers? Explain.
- b. Construct an R-chart from the data.
- c. What does the R-chart indicate about the stability of the filling process during the time when the data were collected? Justify your answer.
- d. Should the control limit(s) be used to monitor future process output? Explain.
- e. Given your answer to part c, should an
Descriptive Statistics for 25 Cola Samples
Want to see the full answer?
Check out a sample textbook solution
Chapter 13 Solutions
Statistics for Business and Economics (13th Edition)


- Is carbon dating? Why does it work? Give an example in which carbon dating would be useful.arrow_forwardRepeat Example 5 when microphone A receives the sound 4 seconds before microphone B.arrow_forwardWhat is a carrying capacity? What kind of model has a carrying capacity built into its formula? Why does this make sense?arrow_forward
- Two pumps capable of delivering 100 hp to an agricultural application are being evaluated in a present economy study. The selected pump will only be utilized for one year, and it will have no market value at the end of the year. Pertinent data are summarized as given follows. If electric power costs $0.10 per kWh and the pump will be operated 4,000 hours per year, which pump should be chosen? Recall that 1 hp = 0.746 kW.arrow_forwardMonica, a chef at a 5-star restaurant makes eight different desserts. She wants to see if the customers prefer any specific dessert to another. She keeps a record of desserts ordered over the course of several weeks, and the results are summarized in the table below. Dessert Frequency Chocolate Mousse 25 Baked Alaska 12 Orange Cheesecake 23 Caramel Flan 32 Banana Broulee 40 Mississippi Mud Pie 20 Ricotta Cannoli 38 French Walnut Torte 34 Find the critical value at .arrow_forwardA medical doctor who had been working in the US states of Arizona and New Mexico moved to the state of Minnesota near the border with North Dakota (see map below). He was surprised when he saw lower mortality rates of skin cancer in Minnesota/North Dakota than he saw in Arizona/New Mexico. Based on his observations that the two northern states had lower mortality rates of skin cancer than the two southern states, he developed the following hypothesis- increasing latitude (moving farther north in the northern hemisphere) causes the mortality rates of skin cancer to decrease. To test this hypothesis he determined the mortality rate of skin cancer in each of the 50 states and determined the latitude of the center of the state. Prediction: if the hypothesis is true, there should be a negative correlation between latitude and skin cancer mortality rates, as shown below. Comment on the doctor’s conclusion that his results show that increasing latitude caused skin cancer mortality…arrow_forward
- Kaitlyn measures the upload speed in megabits per second of her home broadband internet connection during peak hours and off-peak hours. The results are provided in the accompanying table. Peak Off-Peak 5.83 5.14 6.05 6.80 7.14 6.98 3.54 5.77 5.45 7.27 5.90 6.62 5.81 6.19 4.82 6.08 6.37 6.59 4.65 5.58 5.30 7.41 6.48 6.26 5.96 6.37 5.79 6.31 6.84 6.55 5.06 4.95 5.61 7.03 6.45 6.77 Examine the results of Kaitlyn's test to determine the statements that compare the medians and interquartile ranges of the data sets to each other in terms of this situation. Select the two correct answers. The median upload speed during peak hours is 5.905 megabits per second, which is less than the median upload speed during off-peak hours, 7.005 megabits per second. The upload speeds during peak hours are slower on average compared to off-peak times. The median upload speed during peak hours is 6.37 megabits per second, which is greater than the median upload speed during…arrow_forwardcalculate d and e with good working outs ...arrow_forwardAt Chairs and More, assemblers are apud according to the following differential piece rate scale 1-25 chairs in a week, $10 each; 26-40 chairs in a week $13 each; 40 up chairs in a week $17.50. Salina Grant assembled 47 chairs in one week. Find her gross pay.arrow_forward
- The per capita consumption of breakfast cereal in the US has the following model that appears below...arrow_forwardThe activities required to service a car at the Exclusive Car Mart is summarised in the following table: Table 1: Activity Times and Predecessors Minutes Required Activity Description Predecessor Activity Optimistic a Most Likely m Pessimistic b A B C D E F G H Drain Oil Replace Filter Refill Oil Check Tyres Wash Windows Fill Fluids Service A/c Final Test --- A B, E --- D E C C, F 3 2 3 3 4 4 3 1.5 4.5 3 4.5 4 3 4 3 2 7 5 6 6 7 6 5 3.5 The variability in times required to perform each activity is due to the different types, sizes, and conditions of the cars to be serviced. Required Draw the activity network for this problem (either AON or AOA) Determine the Expected Time and Variance for each activity. Round to 2 decimal places where applicable. Show the activity schedule (ES, EF, LS, and LF) as well as slack. Determine and state the critical path for this project. This must be based on your work in c) and not by inspection.…arrow_forward

 Trigonometry (MindTap Course List)TrigonometryISBN:9781337278461Author:Ron LarsonPublisher:Cengage Learning