Statistics for Business and Economics (13th Edition)
13th Edition
ISBN: 9780134648385
Author: MCCLAVE
Publisher: PEARSON
bartleby

Videos

Textbook Question
Book Icon
Chapter 13.4, Problem 13.15ACB

Pain levels of ICU patients. Various interventions are available for nurses to help relieve patients’ pain (e.g., heat/cold applications, breathing exercises, massage). The journal Research in Nursing & Health (Vol. 35, 2012) demonstrated the utility of statistical process control in determining the effectiveness of a pain intervention. The researchers presented the following illustration. Pain levels (measured on a 100-point scale) were recorded for a sample of 10 intensive care unit (ICU) patients 24 hours postsurgery each week for 20 consecutive weeks. The next table provides the means and ranges for each of the 20 weeks. To establish that the pain management process is “in control,” an x ¯ -chart is constructed.

  1. a. Compute the value of the centerline for the x ¯ -chart.
  2. b. Compute the value of R ¯ .
  3. c. Compute the UCL and LCL for the x ¯ -chart.
  4. d. Plot the means for the 20 weeks on the x ¯ -chart. Is the pain management process "in control"?
  5. e. After the 20th week, a pain intervention occurred in the ICU. The goal of the intervention was to reduce the average pain level of ICU patients. To determine if the intervention was effective, the sampling of ICU patients was continued for 8 more consecutive weeks. The mean pain levels of these patients were (in order): 71, 72, 69, 67, 66, 65, 64, and 62. Plot these means on the x ¯ -chart.
  6. f. Apply pattern-analysis rules to the extended x ¯ -chart, part e. Do you detect a shift in the mean pain level of the patients following the intervention? Explain.

Data for Exercise 13.15

Chapter 13.4, Problem 13.15ACB, Pain levels of ICU patients. Various interventions are available for nurses to help relieve patients

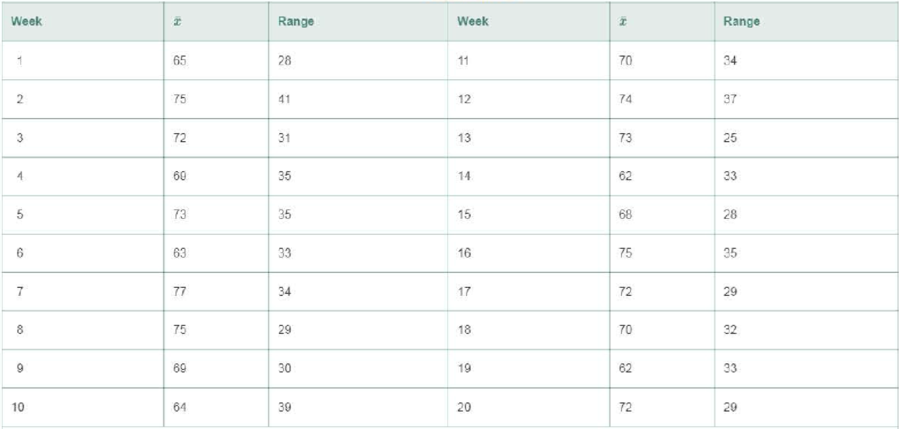
Source: Based on D. F. Polit and W. Chaboyer. Statistical Process Control in Nursing Research,” Research in Nursing & Health, VoL. 35. No. 1. February 2012.

Blurred answer

Chapter 13 Solutions

Statistics for Business and Economics (13th Edition)

Ch. 13.4 - The data in the following table were collected for...Ch. 13.4 - Prob. 13.12ACBCh. 13.4 - Active pharmaceutical ingredient. During the...Ch. 13.4 - Detecting gender-related employment disparities....Ch. 13.4 - Pain levels of ICU patients. Various interventions...Ch. 13.4 - Quality control for irrigation data. Most farmers...Ch. 13.4 - Improving public health waiting times. Statistical...Ch. 13.4 - Cereal box manufacturing. A machine at K-Company...Ch. 13.4 - Detecting under-reported emissions. The...Ch. 13.4 - 13 20 Selecting the best wafer-slicing machine....Ch. 13.4 - Chunky data. BPI Consulting, a leading provider of...Ch. 13.4 - Military aircraft bolts. A precision parts...Ch. 13.5 - What characteristic of a process is an R-chart...Ch. 13.5 - Prob. 13.24LMCh. 13.5 - Use Table IX on page 13-74 to find the values of...Ch. 13.5 - Construct and interpret an R-chart for the data in...Ch. 13.5 - Construct and interpret an R-chart for the data in...Ch. 13.5 - Construct and interpret an R-chart and an x -chart...Ch. 13.5 - Weight of packed frozen scallops. In Quality...Ch. 13.5 - Detecting gender-related employment disparities....Ch. 13.5 - Pain levels of ICU patients. Refer to the Research...Ch. 13.5 - Quality control for irrigation data. Refer to...Ch. 13.5 - Lowering the thickness of an expensive blow-molded...Ch. 13.5 - Cola bottle filling process. A soft-drink bottling...Ch. 13.5 - Chunky data. Refer to Exercise 13.21e (p. 13-40)...Ch. 13.5 - Replacement times for lost ATM cards. In an effort...Ch. 13.5 - Military aircraft bolts. Refer to the...Ch. 13.5 - Precision of scale weight measurements. The...Ch. 13.6 - What characteristic of a process is a p-chart...Ch. 13.6 - In each of the following cases, use the sample...Ch. 13.6 - The proportion of defective items generated by a...Ch. 13.6 - To construct a p-chart for a manufacturing...Ch. 13.6 - To construct a p-chart, 20 samples of size 150...Ch. 13.6 - Academic failure rates in Nigeria. The quality...Ch. 13.6 - Monitoring surgery complications. An article on...Ch. 13.6 - Rental car call center study. A worldwide rental...Ch. 13.6 - Defective micron chips. A manufacturer produces...Ch. 13.6 - Hand break cable defects. In Control Engineering...Ch. 13.6 - Monitoring newspaper typesetters. Accurate...Ch. 13.6 - Quality of rewritable CDs. A Japanese compact disc...Ch. 13.6 - Leaky process pumps. Quality (February 2008)...Ch. 13.6 - Rubber company lire tests. Goodstone Tire Rubber...Ch. 13.7 - Explain why it is inappropriate to conduct a...Ch. 13.7 - Explain the difference between process spread and...Ch. 13.7 - Describe two different ways to assess the...Ch. 13.7 - Why is it recommended to use and interpret Cp in...Ch. 13.7 - For a process that is in control and follows a...Ch. 13.7 - Find the specification spread for each of the...Ch. 13.7 - Find (or estimate) the process spread for each of...Ch. 13.7 - Find the value of Cp for each of the following...Ch. 13.7 - Upper specification limit of a process. An...Ch. 13.7 - Capability of an in-control process. A process is...Ch. 13.7 - Water use at a thermal power plant. Thermal power...Ch. 13.7 - Cereal box filling process. Refer to the data on...Ch. 13.7 - Military aircraft bolts. Refer to Exercise 13.22...Ch. 13.7 - Bioreactor production of antibodies. Benchtop...Ch. 13.7 - Driver gear bore holes. During the manufacture of...Ch. 13.7 - Lowering the thickness of an expensive blow-molded...Ch. 13 - Define quality and list its important dimensions.Ch. 13 - What is a process? Give an example of an...Ch. 13 - What is a system? Give an example of a system with...Ch. 13 - Describe the six major sources of process...Ch. 13 - Suppose all the output of a process over the last...Ch. 13 - Processes that are in control are predictable;...Ch. 13 - Compare and contrast special and common causes...Ch. 13 - Explain the difference between control limits and...Ch. 13 - Should control charts be used to monitor a process...Ch. 13 - Under what circumstances is it appropriate to use...Ch. 13 - A process is under control and follows a normal...Ch. 13 - Weight of a product. Consider the time series data...Ch. 13 - Lengths of pencils. The length measurements of 20...Ch. 13 - Applying pattern-analysis rules. Use the...Ch. 13 - Defective plastic mold. A company that...Ch. 13 - Robotics clamp gap width. Control chart...Ch. 13 - Package sorting time. AirExpress. an overnight...Ch. 13 - Waiting times of airline passengers. Officials at...Ch. 13 - Defects in graphite shafts. Over the last year, a...Ch. 13 - New iron-making process. Mining Engineering...Ch. 13 - CPU of a computer chip. The central processing...Ch. 13 - Bayfield Mud Company case. The text Quantitative...
Knowledge Booster
Background pattern image
Statistics
Learn more about
Need a deep-dive on the concept behind this application? Look no further. Learn more about this topic, statistics and related others by exploring similar questions and additional content below.
Recommended textbooks for you
Text book image
Glencoe Algebra 1, Student Edition, 9780079039897...
Algebra
ISBN:9780079039897
Author:Carter
Publisher:McGraw Hill
Text book image
College Algebra (MindTap Course List)
Algebra
ISBN:9781305652231
Author:R. David Gustafson, Jeff Hughes
Publisher:Cengage Learning
Chi Square test; Author: Vectors Academy;https://www.youtube.com/watch?v=f53nXHoMXx4;License: Standard YouTube License, CC-BY