
Statistics for Business and Economics (13th Edition)
13th Edition
ISBN: 9780134648385
Author: MCCLAVE
Publisher: PEARSON
expand_more
expand_more
format_list_bulleted
Videos
Textbook Question
Chapter 13.5, Problem 13.33ACI
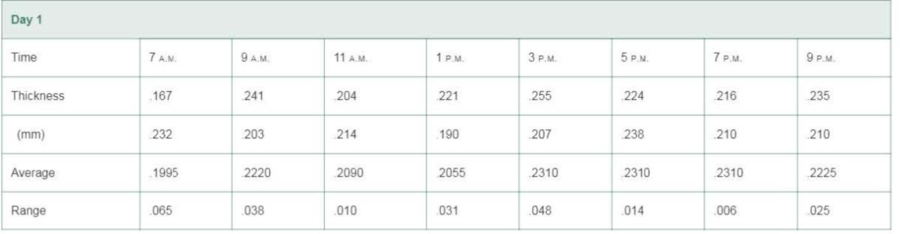
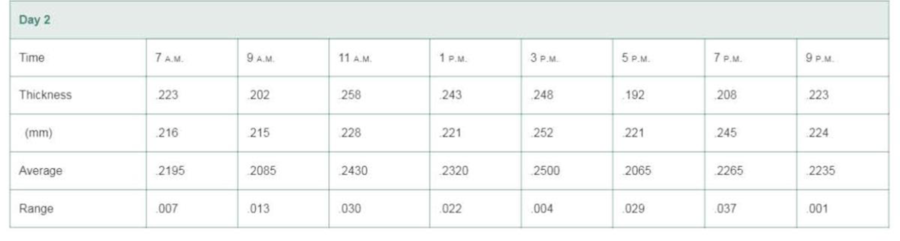
Lowering the thickness of an expensive blow-molded container. Quality (March 2009) presented a problem that actually occurred at a plant that produces a high-volume, blow-molded container with multiple layers. One of the layers is very expensive to manufacture. The quality manager at the plant desires to lower the average thickness for the expensive layer of material and still meet specifications. To estimate the actual thickness for this layer, the manager measured the thickness for one container from each of two cavities every 2 hours for 2 consecutive days. The data (in millimeters) are shown in the following tables.
- a. Construct an R -chart for the data.
- b. Construct an
- c. Based on the control charts in parts a and b, comment on the current behavior of the manufacturing process. As part of your answer, give an estimate of the true average thickness of the expensive layer.
Expert Solution & Answer
Want to see the full answer?
Check out a sample textbook solution
Students have asked these similar questions
Airphone, Inc., manufactures cellular telephones at a pro-cessing cost of $47 per unit. The company produces an
average of 250 phones per week and has a yield of 87%good-quality phones, resulting in 13% defective phones,all of which can be reworked. The cost of reworking adefective telephone is $16.a. Compute the quality-productivity ratio (QPR).b. Compute the QPR if the company increased theproduction rate to 320 phones per week while reducingthe processing cost to $42, reducing the rework cost to$12, and increasing the product yield of good-qualitytelephones to 94%.
The owner of a moving company typically has his most experienced manager predict the total number of labor hours that will be required to complete an upcoming move. This approach has proved useful in the past, but the owner has the business objective of developing a more accurate method of predicting labor hours. In a preliminary effort to provide a more accurate method, the owner has decided to use the number of cubic feet moved as the independent variable and has collected data for 36 moves in which the origin and destination were within the borough of Manhattan in New York City and in which the travel time was an insignificant portion of the hours worked. If the sum of squares Y is 1,513.32 and the sum of squares error is 176.22.
What proportion of variation in labor hours is explained by the number of cubic feet moved?
Hint: Provide answer accurate to 4 decimal places.
The general perception is that the manufacturer of the product can reduce the cost required to manufacture a single product by increasing the number of manufactured products. The following material lists the quantities of products produced by one manufacturer and the corresponding costs per product.
Material:
nro of products
10
20
50
100
150
200
manufacturing cost per product
9.4
9.2
9.0
8.5
8.1
7.4
a) Calculate the forecast for the product-specific manufacturing cost when a batch of 125 products has been ordered from the manufacturer.b) Estimate the variance parameter σ2 of the linear model in point a.c) Calculate the 99 percent prediction interval for the manufacturing cost per product when a batch of 110 products is ordered from the manufacturer.
Chapter 13 Solutions
Statistics for Business and Economics (13th Edition)
Ch. 13.4 - What is a control chart? Describe its use.Ch. 13.4 - Explain why rational subgrouping should be used in...Ch. 13.4 - When a control chart is first constructed, why are...Ch. 13.4 - Which process parameter is an x -chart used to...Ch. 13.4 - Even if all the points on an x -chart fall between...Ch. 13.4 - What must be true about the variation of a process...Ch. 13.4 - Use the six pattern-analysis rules described in...Ch. 13.4 - Consider the x -chart shown below. a. Is the...Ch. 13.4 - Use Table IX on page 13-74 to find the value of A2...Ch. 13.4 - Twenty-five consecutive samples of size n = 5 were...
Ch. 13.4 - The data in the following table were collected for...Ch. 13.4 - Prob. 13.12ACBCh. 13.4 - Active pharmaceutical ingredient. During the...Ch. 13.4 - Detecting gender-related employment disparities....Ch. 13.4 - Pain levels of ICU patients. Various interventions...Ch. 13.4 - Quality control for irrigation data. Most farmers...Ch. 13.4 - Improving public health waiting times. Statistical...Ch. 13.4 - Cereal box manufacturing. A machine at K-Company...Ch. 13.4 - Detecting under-reported emissions. The...Ch. 13.4 - 13 20 Selecting the best wafer-slicing machine....Ch. 13.4 - Chunky data. BPI Consulting, a leading provider of...Ch. 13.4 - Military aircraft bolts. A precision parts...Ch. 13.5 - What characteristic of a process is an R-chart...Ch. 13.5 - Prob. 13.24LMCh. 13.5 - Use Table IX on page 13-74 to find the values of...Ch. 13.5 - Construct and interpret an R-chart for the data in...Ch. 13.5 - Construct and interpret an R-chart for the data in...Ch. 13.5 - Construct and interpret an R-chart and an x -chart...Ch. 13.5 - Weight of packed frozen scallops. In Quality...Ch. 13.5 - Detecting gender-related employment disparities....Ch. 13.5 - Pain levels of ICU patients. Refer to the Research...Ch. 13.5 - Quality control for irrigation data. Refer to...Ch. 13.5 - Lowering the thickness of an expensive blow-molded...Ch. 13.5 - Cola bottle filling process. A soft-drink bottling...Ch. 13.5 - Chunky data. Refer to Exercise 13.21e (p. 13-40)...Ch. 13.5 - Replacement times for lost ATM cards. In an effort...Ch. 13.5 - Military aircraft bolts. Refer to the...Ch. 13.5 - Precision of scale weight measurements. The...Ch. 13.6 - What characteristic of a process is a p-chart...Ch. 13.6 - In each of the following cases, use the sample...Ch. 13.6 - The proportion of defective items generated by a...Ch. 13.6 - To construct a p-chart for a manufacturing...Ch. 13.6 - To construct a p-chart, 20 samples of size 150...Ch. 13.6 - Academic failure rates in Nigeria. The quality...Ch. 13.6 - Monitoring surgery complications. An article on...Ch. 13.6 - Rental car call center study. A worldwide rental...Ch. 13.6 - Defective micron chips. A manufacturer produces...Ch. 13.6 - Hand break cable defects. In Control Engineering...Ch. 13.6 - Monitoring newspaper typesetters. Accurate...Ch. 13.6 - Quality of rewritable CDs. A Japanese compact disc...Ch. 13.6 - Leaky process pumps. Quality (February 2008)...Ch. 13.6 - Rubber company lire tests. Goodstone Tire Rubber...Ch. 13.7 - Explain why it is inappropriate to conduct a...Ch. 13.7 - Explain the difference between process spread and...Ch. 13.7 - Describe two different ways to assess the...Ch. 13.7 - Why is it recommended to use and interpret Cp in...Ch. 13.7 - For a process that is in control and follows a...Ch. 13.7 - Find the specification spread for each of the...Ch. 13.7 - Find (or estimate) the process spread for each of...Ch. 13.7 - Find the value of Cp for each of the following...Ch. 13.7 - Upper specification limit of a process. An...Ch. 13.7 - Capability of an in-control process. A process is...Ch. 13.7 - Water use at a thermal power plant. Thermal power...Ch. 13.7 - Cereal box filling process. Refer to the data on...Ch. 13.7 - Military aircraft bolts. Refer to Exercise 13.22...Ch. 13.7 - Bioreactor production of antibodies. Benchtop...Ch. 13.7 - Driver gear bore holes. During the manufacture of...Ch. 13.7 - Lowering the thickness of an expensive blow-molded...Ch. 13 - Define quality and list its important dimensions.Ch. 13 - What is a process? Give an example of an...Ch. 13 - What is a system? Give an example of a system with...Ch. 13 - Describe the six major sources of process...Ch. 13 - Suppose all the output of a process over the last...Ch. 13 - Processes that are in control are predictable;...Ch. 13 - Compare and contrast special and common causes...Ch. 13 - Explain the difference between control limits and...Ch. 13 - Should control charts be used to monitor a process...Ch. 13 - Under what circumstances is it appropriate to use...Ch. 13 - A process is under control and follows a normal...Ch. 13 - Weight of a product. Consider the time series data...Ch. 13 - Lengths of pencils. The length measurements of 20...Ch. 13 - Applying pattern-analysis rules. Use the...Ch. 13 - Defective plastic mold. A company that...Ch. 13 - Robotics clamp gap width. Control chart...Ch. 13 - Package sorting time. AirExpress. an overnight...Ch. 13 - Waiting times of airline passengers. Officials at...Ch. 13 - Defects in graphite shafts. Over the last year, a...Ch. 13 - New iron-making process. Mining Engineering...Ch. 13 - CPU of a computer chip. The central processing...Ch. 13 - Bayfield Mud Company case. The text Quantitative...
Knowledge Booster


Learn more about
Need a deep-dive on the concept behind this application? Look no further. Learn more about this topic, statistics and related others by exploring similar questions and additional content below.Similar questions
- The owner of a moving company typically has his most experienced manager predict the total number of labor hours that will be required to complete an upcoming move. This approach has proved useful in the past, but the owner has the business objective of developing a more accurate method of predicting labor hours. In a preliminary effort to provide a more accurate method, the owner has decided to use the number of cubic feet moved as the independentvariable and has collected data for 36 moves in which the origin and destination were within the borough of Manhattan in New York City and in which the travel time was an insignificant portionof the hours worked. The intercept for the sample regression line that the owner has computed is -2.37 and the slope is 0.04. If the actual number of labor hours for moving 407 cubic feet is 33.47. What is the error of prediction? Hint: Provide answer accurate to 2 decimal places.arrow_forwardLife-saving drug: Penicillin is produced by the Penicillin fungus, which is grown in a broth whose sugar content must be carefully controlled. Several samples of broth were taken on three successive days, and the amount of dissolved sugars, in milligrams per milliliter, was measured on each sample. The results were as follows. Day 1: 5.2 5.0 5.4 5.2 5.3 5.0 4.9 5.0 5.2 5.0 4.6 5.3 Day 2: 5.6 4.8 4.9 5.3 5.2 4.9 5.4 5.0 5.4 4.9 5.5 5.4 Day 3: 5.9 4.9 5.3 5.4 5.2 5.5 5.0 5.8 5.5 5.4 5.4 5.1 Construct an ANOVA table. Round your answers to four decimal places as needed. One-way ANOVA: Sugar Concentration Source DF SS MS F P Days Error Totalarrow_forwarda. Compute the incidence rate of coronary artery disease in patients receiving the new cholesterol medication. b. Compute the incidence rate of coronary artery disease in patients receiving a placebo. attached is the image of the data for this problemarrow_forward
arrow_back_ios
arrow_forward_ios
Recommended textbooks for you
 Linear Algebra: A Modern IntroductionAlgebraISBN:9781285463247Author:David PoolePublisher:Cengage Learning
Linear Algebra: A Modern Introduction
Algebra
ISBN:9781285463247
Author:David Poole
Publisher:Cengage Learning
Solve ANY Optimization Problem in 5 Steps w/ Examples. What are they and How do you solve them?; Author: Ace Tutors;https://www.youtube.com/watch?v=BfOSKc_sncg;License: Standard YouTube License, CC-BY
Types of solution in LPP|Basic|Multiple solution|Unbounded|Infeasible|GTU|Special case of LP problem; Author: Mechanical Engineering Management;https://www.youtube.com/watch?v=F-D2WICq8Sk;License: Standard YouTube License, CC-BY
Optimization Problems in Calculus; Author: Professor Dave Explains;https://www.youtube.com/watch?v=q1U6AmIa_uQ;License: Standard YouTube License, CC-BY
Introduction to Optimization; Author: Math with Dr. Claire;https://www.youtube.com/watch?v=YLzgYm2tN8E;License: Standard YouTube License, CC-BY