
APPLIED STAT.IN BUS.+ECONOMICS
6th Edition
ISBN: 9781259957598
Author: DOANE
Publisher: RENT MCG
expand_more
expand_more
format_list_bulleted
Videos
Textbook Question
Chapter 14, Problem 11CE
(a) Plot both Swiss watch time series on the same graph. (b) Describe the trend (if any) and discuss possible causes. (c) Fit an exponential trend to each time series. (d) Interpret each fitted trend carefully. What conclusion do you draw? (e) Make forecasts for the next three years, using the linear trend model. (f) Why might 2009 have been unusual? Explain.  Swiss
Swiss
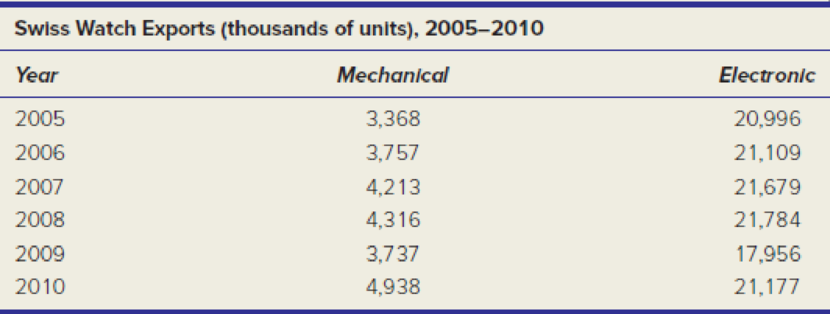
Source: Federation de L’ Industrie Horlogere Suisse, Swiss Watch Exports, www.fhs.ch/en/statistics.php.
Expert Solution & Answer
Want to see the full answer?
Check out a sample textbook solution
Students have asked these similar questions
Time series data usually shows a pattern, which is caused by a systematic and unsystematic pattern.
ncreased sales during the Christmas season is known as
a. secular
b. seasonal trend
c. Cyclical trend
d .irregular trend
What do the Forecast for each year add up to?
Chapter 14 Solutions
APPLIED STAT.IN BUS.+ECONOMICS
Ch. 14.2 - (a) Make an Excel graph of the data on the number...Ch. 14.2 - Prob. 3SECh. 14.2 - Prob. 4SECh. 14.2 - Prob. 5SECh. 14.4 - (a) Make an Excel line graph of the exchange rate...Ch. 14.5 - (a) Make an Excel line graph of the following bond...Ch. 14 - Explain the difference between (a) stocks and...Ch. 14 - (a) What is periodicity? (b) Give original...Ch. 14 - (a) What are the distinguishing features of each...Ch. 14 - Name four criteria for assessing a trend forecast.
Ch. 14 - Name two advantages and two disadvantages of each...Ch. 14 - When would the exponential trend model be...Ch. 14 - Explain how to obtain the compound percent growth...Ch. 14 - (a) When might a quadratic model be useful? (b)...Ch. 14 - Name five measures of fit for a trend, and state...Ch. 14 - Prob. 10CRCh. 14 - Prob. 11CRCh. 14 - Prob. 12CRCh. 14 - (a) Why is seasonality irrelevant for annual data?...Ch. 14 - Prob. 14CRCh. 14 - (a) Explain how seasonal binaries can be used to...Ch. 14 - What is the purpose of index numbers?Ch. 14 - (a) Make a line chart for JetBlues revenue. (b)...Ch. 14 - (a) Plot both Swiss watch time series on the same...Ch. 14 - (a) Make a line graph of the U.S. civilian labor...Ch. 14 - (a) Plot the voter participation rate. (b)...Ch. 14 - For each of the following fitted trends, make a...Ch. 14 - (a) Make a line graph of consumer credit...Ch. 14 - (a) Plot the data on U.S. general aviation...Ch. 14 - Prob. 17CECh. 14 - (a) Plot either receipts and outlays or federal...Ch. 14 - Prob. 19CECh. 14 - (a) Plot the data on leisure and hospitality...Ch. 14 - Prob. 21CECh. 14 - Prob. 22CECh. 14 - (a) Plot the data on skier/snowboard visits. (b)...Ch. 14 - Prob. 24CECh. 14 - (a) Plot U.S. petroleum imports on a graph. (b)...Ch. 14 - (a) Make a line chart and fit an m-period moving...Ch. 14 - Refer to exercise 14.26. (a) Plot the dollar/pound...Ch. 14 - (a) Plot the data on natural gas bills. (b) Can...Ch. 14 - (a) Plot the data on air travel delays. (b) Can...Ch. 14 - (a) Plot the data on airplane shipments. (b) Can...Ch. 14 - (a) Plot the data on revolving credit (credit...Ch. 14 - The following seasonal regression was fitted with...Ch. 14 - The following seasonal regression was fitted with...
Knowledge Booster


Learn more about
Need a deep-dive on the concept behind this application? Look no further. Learn more about this topic, statistics and related others by exploring similar questions and additional content below.Similar questions
- The president of State University wants to forecast student enrollments for this Year academic year based on the following historical data: 5 years ago 4 years ago 3 years ago 2 years ago Last year Enrollments 15.000 16.000 18.000 20.000 21.000 a- What is the forecast for this year using a 3-year weighted moving average where the weights are halved in a descending order from newest to oldest ? b. What is the forecast for this year using the trend line for these data? c. using the MAD find which forecasting technique may be appropriate for this quetionarrow_forwardHow do I construct a time series plot and determine type of pattern in data?arrow_forwardIllustrate the formulation of dynamic causal effects in time series data?arrow_forward
- Examine the data for each race/ethnicity group. Do the data represent a stationary or nonstationary process? Do any of the race/ethnicity groups exhibit a decreasing trend? Do any of the race/ethnicity groups show a strictly increasing trend over the entire time period from 2000 to 2016?arrow_forwardthe costello Music company has been in business for five years. during that time, salesof pianos increased from 12 units in the first year to 76 units in the most recent year. Fredcostello, the firm’s owner, wants to develop a forecast of piano sales for the coming year.the historical data follow.Year 1 2 3 4 5Sales 12 28 34 50 76a. construct a time series plot. What type of pattern exists in the data?b. develop the linear trend equation for the time series. What is the average increase insales that the firm has been realizing per year?c. Forecast sales for years 6 and 7.arrow_forwardExplain Causal Effects and Time Series Data?arrow_forward
- What are the characteristics of a "times series" and "times series plot"?arrow_forwardA time series plot of a period of time (in weeks) versus sales is shown below. Which of the following data patterns best describes the scenario shown? a. Time series with a linear trend pattern b. Time series with a seasonal pattern c. Time series with no pattern d. Time series with a horizontal patternarrow_forwardWhat is the definition of a covariance stationary process? Why is stationaritysuch as important issue in forecasting and time-series?arrow_forward
- What is the most effective method for predicting future stock prices based on historical data, and how accurate are these predictions compared to other forecasting models?arrow_forwardWhich of the following time series forecasting methods would not be used to forecast seasonal data?arrow_forwardDefine concept of Avoiding the Problems Caused by Stochastic Trends?arrow_forward
arrow_back_ios
SEE MORE QUESTIONS
arrow_forward_ios
Recommended textbooks for you
 Functions and Change: A Modeling Approach to Coll...AlgebraISBN:9781337111348Author:Bruce Crauder, Benny Evans, Alan NoellPublisher:Cengage Learning
Functions and Change: A Modeling Approach to Coll...
Algebra
ISBN:9781337111348
Author:Bruce Crauder, Benny Evans, Alan Noell
Publisher:Cengage Learning
Time Series Analysis Theory & Uni-variate Forecasting Techniques; Author: Analytics University;https://www.youtube.com/watch?v=_X5q9FYLGxM;License: Standard YouTube License, CC-BY
Operations management 101: Time-series, forecasting introduction; Author: Brandoz Foltz;https://www.youtube.com/watch?v=EaqZP36ool8;License: Standard YouTube License, CC-BY