
APPLIED STAT.IN BUS.+ECONOMICS
6th Edition
ISBN: 9781259957598
Author: DOANE
Publisher: RENT MCG
expand_more
expand_more
format_list_bulleted
Videos
Textbook Question
Chapter 14, Problem 27CE
Refer to exercise 14.26. (a) Plot the dollar/pound exchange rate data. Copy and paste the chart so that you have four copies (one for each α). (b) Perform simple exponential smoothing (using Excel’s Data Analysis or other software such as Minitab) using α = .05, .10, .20, and .50. (c) Which value of α do you prefer? Why? (d) Is exponential smoothing appropriate for this kind of data?
14.26 (a) Make a line chart and fit an m-period moving average to the exchange rate data shown below with m = 2, 3, 4, and 5 periods. For each method, state the last MA value. (b) Which value of m do you prefer? Why? (c) Is a moving average appropriate for this kind of data?
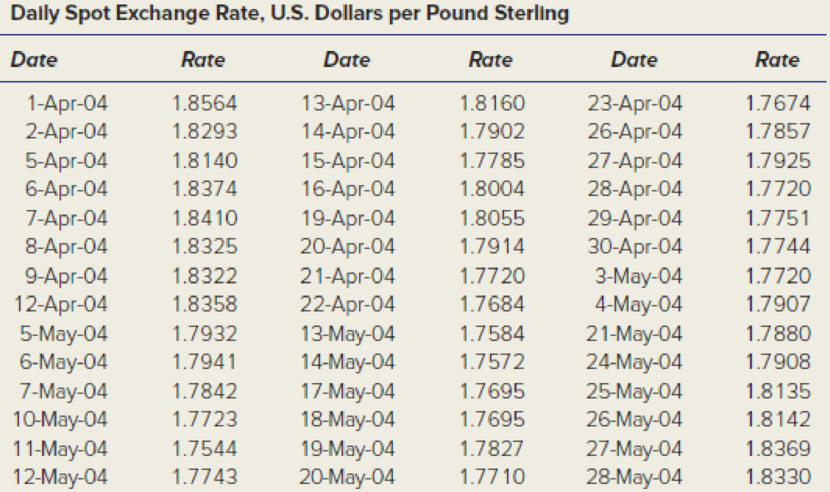
Source: Federal Reserve Board of Governors.
Expert Solution & Answer
Want to see the full answer?
Check out a sample textbook solution
Chapter 14 Solutions
APPLIED STAT.IN BUS.+ECONOMICS
Ch. 14.2 - (a) Make an Excel graph of the data on the number...Ch. 14.2 - Prob. 3SECh. 14.2 - Prob. 4SECh. 14.2 - Prob. 5SECh. 14.4 - (a) Make an Excel line graph of the exchange rate...Ch. 14.5 - (a) Make an Excel line graph of the following bond...Ch. 14 - Explain the difference between (a) stocks and...Ch. 14 - (a) What is periodicity? (b) Give original...Ch. 14 - (a) What are the distinguishing features of each...Ch. 14 - Name four criteria for assessing a trend forecast.
Ch. 14 - Name two advantages and two disadvantages of each...Ch. 14 - When would the exponential trend model be...Ch. 14 - Explain how to obtain the compound percent growth...Ch. 14 - (a) When might a quadratic model be useful? (b)...Ch. 14 - Name five measures of fit for a trend, and state...Ch. 14 - Prob. 10CRCh. 14 - Prob. 11CRCh. 14 - Prob. 12CRCh. 14 - (a) Why is seasonality irrelevant for annual data?...Ch. 14 - Prob. 14CRCh. 14 - (a) Explain how seasonal binaries can be used to...Ch. 14 - What is the purpose of index numbers?Ch. 14 - (a) Make a line chart for JetBlues revenue. (b)...Ch. 14 - (a) Plot both Swiss watch time series on the same...Ch. 14 - (a) Make a line graph of the U.S. civilian labor...Ch. 14 - (a) Plot the voter participation rate. (b)...Ch. 14 - For each of the following fitted trends, make a...Ch. 14 - (a) Make a line graph of consumer credit...Ch. 14 - (a) Plot the data on U.S. general aviation...Ch. 14 - Prob. 17CECh. 14 - (a) Plot either receipts and outlays or federal...Ch. 14 - Prob. 19CECh. 14 - (a) Plot the data on leisure and hospitality...Ch. 14 - Prob. 21CECh. 14 - Prob. 22CECh. 14 - (a) Plot the data on skier/snowboard visits. (b)...Ch. 14 - Prob. 24CECh. 14 - (a) Plot U.S. petroleum imports on a graph. (b)...Ch. 14 - (a) Make a line chart and fit an m-period moving...Ch. 14 - Refer to exercise 14.26. (a) Plot the dollar/pound...Ch. 14 - (a) Plot the data on natural gas bills. (b) Can...Ch. 14 - (a) Plot the data on air travel delays. (b) Can...Ch. 14 - (a) Plot the data on airplane shipments. (b) Can...Ch. 14 - (a) Plot the data on revolving credit (credit...Ch. 14 - The following seasonal regression was fitted with...Ch. 14 - The following seasonal regression was fitted with...
Knowledge Booster


Learn more about
Need a deep-dive on the concept behind this application? Look no further. Learn more about this topic, statistics and related others by exploring similar questions and additional content below.Similar questions
- What does the y -intercept on the graph of a logistic equation correspond to for a population modeled by that equation?arrow_forwardTable 2 shows a recent graduate’s credit card balance each month after graduation. a. Use exponential regression to fit a model to these data. b. If spending continues at this rate, what will the graduate’s credit card debt be one year after graduating?arrow_forwardDoes a linear, exponential, or logarithmic model best fit the data in Table 2? Find the model.arrow_forward
- Is carbon dating? Why does it work? Give an example in which carbon dating would be useful.arrow_forwardWhat is the y -intercept on the graph of the logistic model given in the previous exercise?arrow_forwardTable 6 shows the population, in thousands, of harbor seals in the Wadden Sea over the years 1997 to 2012. a. Let x represent time in years starting with x=0 for the year 1997. Let y represent the number of seals in thousands. Use logistic regression to fit a model to these data. b. Use the model to predict the seal population for the year 2020. c. To the nearest whole number, what is the limiting value of this model?arrow_forward
- Jerome invests $18,000 at age 17. He hopes the investments will be worth $30,000 when he turns 26. If the interest compounds continuously, approximately what rate of growth will he need to achieve his goal? Is that a reasonable expectation?arrow_forwardWhat is the y -intercept of the logistic growth model y=c1+aerx ? Show the steps for calculation. What does this point tell us about the population?arrow_forwardThe U.S. Census tracks the percentage of persons 25 years or older who are college graduates. That data forseveral years is given in Table 4[14]. Determine whether the trend appears linear. If so, and assuming the trendcontinues. in what year will the percentage exceed 35%?arrow_forward
- Explain why the values of an increasing exponentialfunction will eventually overtake the valuesof anincreasing linear function.arrow_forwardThe US. import of wine (in hectoliters) for several years is given in Table 5. Determine whether the trend appearslinear. Ifso, and assuming the trend continues, in what year will imports exceed 12,000 hectoliters?arrow_forward
arrow_back_ios
arrow_forward_ios
Recommended textbooks for you


 Glencoe Algebra 1, Student Edition, 9780079039897...AlgebraISBN:9780079039897Author:CarterPublisher:McGraw Hill
 Trigonometry (MindTap Course List)TrigonometryISBN:9781337278461Author:Ron LarsonPublisher:Cengage Learning
Glencoe Algebra 1, Student Edition, 9780079039897...
Algebra
ISBN:9780079039897
Author:Carter
Publisher:McGraw Hill
Trigonometry (MindTap Course List)
Trigonometry
ISBN:9781337278461
Author:Ron Larson
Publisher:Cengage Learning
Time Series Analysis Theory & Uni-variate Forecasting Techniques; Author: Analytics University;https://www.youtube.com/watch?v=_X5q9FYLGxM;License: Standard YouTube License, CC-BY
Operations management 101: Time-series, forecasting introduction; Author: Brandoz Foltz;https://www.youtube.com/watch?v=EaqZP36ool8;License: Standard YouTube License, CC-BY