
Videos
(a) Plot the data on airplane shipments. (b) Can you see seasonal patterns? Explain. (c) Use MegaStat or Minitab to calculate estimated seasonal indexes and trend. (d) In which quarters are shipments highest? Lowest? Can you suggest reasons? (e) Is there a trend in the deseasonalized data?
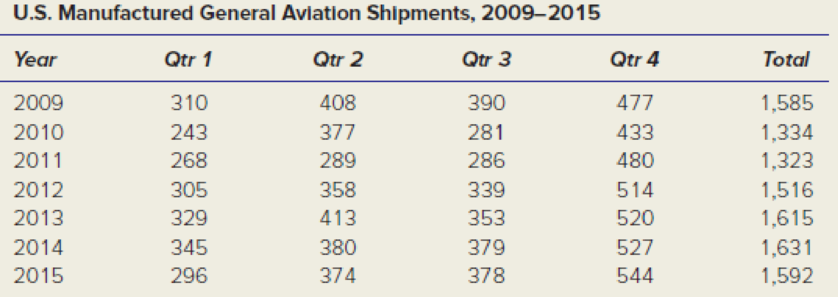
Note: Quarterly shipments may not add to annual total because some manufacturers report only annual totals. Source: U.S. Manufactured General Aviation Shipments, Statistical Databook, General Aviation Manufacturers Association, used with permission. Source: “U.S. Manufactured General Aviation Shipments,” Statistical Databook, General Aviation Manufacturers Association. Note that quarterly shipments may not add to annual total because some manufacturers report only annual totals.
Want to see the full answer?
Check out a sample textbook solution
Chapter 14 Solutions
APPLIED STAT.IN BUS.+ECONOMICS


 Big Ideas Math A Bridge To Success Algebra 1: Stu...AlgebraISBN:9781680331141Author:HOUGHTON MIFFLIN HARCOURTPublisher:Houghton Mifflin Harcourt
 Linear Algebra: A Modern IntroductionAlgebraISBN:9781285463247Author:David PoolePublisher:Cengage Learning
 Glencoe Algebra 1, Student Edition, 9780079039897...AlgebraISBN:9780079039897Author:CarterPublisher:McGraw Hill
 Holt Mcdougal Larson Pre-algebra: Student Edition...AlgebraISBN:9780547587776Author:HOLT MCDOUGALPublisher:HOLT MCDOUGAL