
APPLIED STAT.IN BUS.+ECONOMICS
6th Edition
ISBN: 9781259957598
Author: DOANE
Publisher: RENT MCG
expand_more
expand_more
format_list_bulleted
Videos
Textbook Question
Chapter 14.2, Problem 2SE
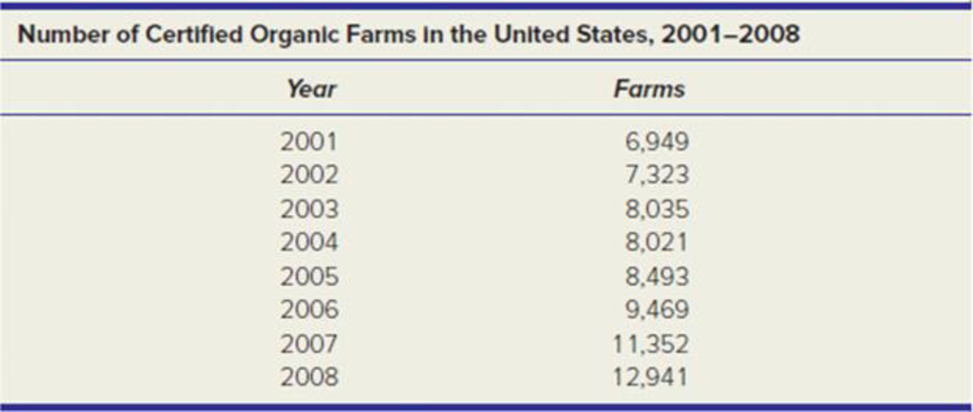
(a) Make an Excel graph of the data on the number of certified organic farms in the United States. (b) Discuss the underlying causes that might explain the trend or pattern. (c) Fit three trends (linear, quadratic, exponential) to the time series. (d) Which trend model do you think is best to make forecasts for the next three years? Why? (e) Use each of the three fitted trend equations to make numerical forecasts for the next three years. How similar are the three models’ forecasts?
Source: www.faa.gov.
Expert Solution & Answer
Want to see the full answer?
Check out a sample textbook solution
Students have asked these similar questions
What Is a Trend? how time series variable fluctuates around its trend?
Illustrate the formulation of dynamic causal effects in time series data?
Relate cycles, seasonality and trends in time series What is their relevance in such type of forecasting?
Chapter 14 Solutions
APPLIED STAT.IN BUS.+ECONOMICS
Ch. 14.2 - (a) Make an Excel graph of the data on the number...Ch. 14.2 - Prob. 3SECh. 14.2 - Prob. 4SECh. 14.2 - Prob. 5SECh. 14.4 - (a) Make an Excel line graph of the exchange rate...Ch. 14.5 - (a) Make an Excel line graph of the following bond...Ch. 14 - Explain the difference between (a) stocks and...Ch. 14 - (a) What is periodicity? (b) Give original...Ch. 14 - (a) What are the distinguishing features of each...Ch. 14 - Name four criteria for assessing a trend forecast.
Ch. 14 - Name two advantages and two disadvantages of each...Ch. 14 - When would the exponential trend model be...Ch. 14 - Explain how to obtain the compound percent growth...Ch. 14 - (a) When might a quadratic model be useful? (b)...Ch. 14 - Name five measures of fit for a trend, and state...Ch. 14 - Prob. 10CRCh. 14 - Prob. 11CRCh. 14 - Prob. 12CRCh. 14 - (a) Why is seasonality irrelevant for annual data?...Ch. 14 - Prob. 14CRCh. 14 - (a) Explain how seasonal binaries can be used to...Ch. 14 - What is the purpose of index numbers?Ch. 14 - (a) Make a line chart for JetBlues revenue. (b)...Ch. 14 - (a) Plot both Swiss watch time series on the same...Ch. 14 - (a) Make a line graph of the U.S. civilian labor...Ch. 14 - (a) Plot the voter participation rate. (b)...Ch. 14 - For each of the following fitted trends, make a...Ch. 14 - (a) Make a line graph of consumer credit...Ch. 14 - (a) Plot the data on U.S. general aviation...Ch. 14 - Prob. 17CECh. 14 - (a) Plot either receipts and outlays or federal...Ch. 14 - Prob. 19CECh. 14 - (a) Plot the data on leisure and hospitality...Ch. 14 - Prob. 21CECh. 14 - Prob. 22CECh. 14 - (a) Plot the data on skier/snowboard visits. (b)...Ch. 14 - Prob. 24CECh. 14 - (a) Plot U.S. petroleum imports on a graph. (b)...Ch. 14 - (a) Make a line chart and fit an m-period moving...Ch. 14 - Refer to exercise 14.26. (a) Plot the dollar/pound...Ch. 14 - (a) Plot the data on natural gas bills. (b) Can...Ch. 14 - (a) Plot the data on air travel delays. (b) Can...Ch. 14 - (a) Plot the data on airplane shipments. (b) Can...Ch. 14 - (a) Plot the data on revolving credit (credit...Ch. 14 - The following seasonal regression was fitted with...Ch. 14 - The following seasonal regression was fitted with...
Knowledge Booster


Learn more about
Need a deep-dive on the concept behind this application? Look no further. Learn more about this topic, statistics and related others by exploring similar questions and additional content below.Similar questions
- How are seasonal adjustments made in a time series analysis? Cyclical and Residual adjustments?arrow_forwardExplain Causal Effects and Time Series Data?arrow_forwardAfter its move in 1990 to La Junta, Colorado, and its new initiatives, the DeBourgh Manufacturing Company began an upward climb of record sales. Suppose the figures shown here are the DeBourgh monthly sales figures from January 2001 through December 2009 (in $1,000s). a) Produce a time series plot. Are there any trends evident in the data? Does DeBourgh have a seasonal component to its sales? b) Deseasonalize the data using Multiplicative model with a 0.5 weighted moving average. Produce a time series plot of the deseasonalized data and add a trendline. c) Forecast the sales from January to December of the year 2010. d) Include a discussion of the general direction of sales and any seasonal tendencies that might be occurrinG Month 2001 2002 2003 2004 2005 2006 2007 2008 2009 January 139.7 165.1 177.8 228.6 266.7 431.8 381 431.8 495.3 February 114.3 177.8 203.2 254 317.5 457.2 406.4 444.5 533.4 March 101.6 177.8 228.6 266.7 368.3 457.2 431.8 495.3 635 April 152.4 203.2…arrow_forward
- Use quantitativeforecast methods for the data shown below Period Observation 1 24 2 34 3 36 4 37 5 41 6 44 7 45 Plot the original time series and comment on appropriateness of a linear trend.arrow_forwardU.S. Civilian Labor Force (thousands) Year Labor Force Year Labor Force 2007 153,918 2012 155,628 2008 154,655 2013 155,151 2009 153,111 2014 156,238 2010 153,650 2015 157,957 2011 153,995 2016 159,640 1. Fit three trend models: linear, exponential, and quadratic. Which model would offer the most believable forecasts? 2. Make forecasts using the following fitted trend models for years 2017-2019. t Exponential 11 12 13arrow_forwardWhich of the time series forecasting methods would not be used to forecast seasonal data?arrow_forward
- An electronic appliance manufacturer wants to know if there is a relationship between percentage change in deposable personal income which is reported quarterly by the government, and the percentage change in appliances sold by the manufacturer following same years of quarterly data. Brenda Chee and Clarence Paulus lead an analyst team has obtained data for the past 10 quarters. (Hint: Provides your answers in two decimal points) Quarter Percent change in income Percent Change in appliance sold Quarter Percent change in income Percent change in appliance sold 1 -2.3 -2.5 6 -1.0 1.0 2 -1.5 -1.0 7 0.7 1.4 3 2.8 7.4 8 5.2 3.4 4 0.5 2.6 9 -2.5 -0.5 5 4.6 8.5 10 1.7 1.8 (a) What forecasting model should be used for this data. Why?(5(b) Develop the forecasting model that you have proposed in (a).(c) Compute the relationship for these data. In your opinion, is the relationship between independentvariable…arrow_forwardwhat the meaning of a temporal decay rate of 0.5 day^-1arrow_forward4. Consider the following data. Period 1 rate of return -6.0. Period 2 rate of return -8.0. Period 3 rate of return -4.0. Period 4 rate of return 2.0. Period 5 rate of return 5.4. What is the mean growth rate over these five periods?arrow_forward
- Which of the following time series forecasting methods would not be used to forecast seasonal data?arrow_forwardU.S. Civilian Labor Force (thousands)Year Labor Force Year Labor Force2007 173,966 2012 175,6762008 174,703 2013 175,1992009 173,159 2014 176,2862010 173,698 2015 178,0052011 174,043 2016 179,688 Make forecasts using the following fitted trend models for years 2017-2019. t Linear Quadratic Exponential 111213arrow_forwardThe following table shows a company's annual revenue (in billions of dollars) for 2009 to 2014. Year Period (t) Revenue 2009 1 23.8 2010 2 29.2 2011 3 37.8 2012 4 50.1 2013 5 59.9 2014 6 66.8 -Develop a linear trend equation for this time series to forecast revenue (in billions of dollars). (Round your numerical values to three decimal places.) -What is the average revenue increase per year (in billions of dollars) that this company has been realizing? (Round your answer to three decimal places.) -Compute an estimate of this company's revenue (in billions of dollars) for 2015. (Round your answer to two decimal places.)arrow_forward
arrow_back_ios
SEE MORE QUESTIONS
arrow_forward_ios
Recommended textbooks for you
 MATLAB: An Introduction with ApplicationsStatisticsISBN:9781119256830Author:Amos GilatPublisher:John Wiley & Sons Inc
 Probability and Statistics for Engineering and th...StatisticsISBN:9781305251809Author:Jay L. DevorePublisher:Cengage Learning
 Statistics for The Behavioral Sciences (MindTap C...StatisticsISBN:9781305504912Author:Frederick J Gravetter, Larry B. WallnauPublisher:Cengage Learning
 Elementary Statistics: Picturing the World (7th E...StatisticsISBN:9780134683416Author:Ron Larson, Betsy FarberPublisher:PEARSON
 The Basic Practice of StatisticsStatisticsISBN:9781319042578Author:David S. Moore, William I. Notz, Michael A. FlignerPublisher:W. H. Freeman
 Introduction to the Practice of StatisticsStatisticsISBN:9781319013387Author:David S. Moore, George P. McCabe, Bruce A. CraigPublisher:W. H. Freeman
MATLAB: An Introduction with Applications
Statistics
ISBN:9781119256830
Author:Amos Gilat
Publisher:John Wiley & Sons Inc
Probability and Statistics for Engineering and th...
Statistics
ISBN:9781305251809
Author:Jay L. Devore
Publisher:Cengage Learning
Statistics for The Behavioral Sciences (MindTap C...
Statistics
ISBN:9781305504912
Author:Frederick J Gravetter, Larry B. Wallnau
Publisher:Cengage Learning
Elementary Statistics: Picturing the World (7th E...
Statistics
ISBN:9780134683416
Author:Ron Larson, Betsy Farber
Publisher:PEARSON
The Basic Practice of Statistics
Statistics
ISBN:9781319042578
Author:David S. Moore, William I. Notz, Michael A. Fligner
Publisher:W. H. Freeman
Introduction to the Practice of Statistics
Statistics
ISBN:9781319013387
Author:David S. Moore, George P. McCabe, Bruce A. Craig
Publisher:W. H. Freeman
Time Series Analysis Theory & Uni-variate Forecasting Techniques; Author: Analytics University;https://www.youtube.com/watch?v=_X5q9FYLGxM;License: Standard YouTube License, CC-BY
Operations management 101: Time-series, forecasting introduction; Author: Brandoz Foltz;https://www.youtube.com/watch?v=EaqZP36ool8;License: Standard YouTube License, CC-BY