
Gen Combo Ll Applied Statistics In Business & Economics; Connect Access Card
6th Edition
ISBN: 9781260260632
Author: David Doane, Lori Seward Senior Instructor of Operations Management
Publisher: McGraw-Hill Education
expand_more
expand_more
format_list_bulleted
Videos
Textbook Question
Chapter 14, Problem 15CE
(a) Make a line graph of consumer credit outstanding. (b) Describe the trend (if any) and discuss possible causes. (c) Fit linear, exponential, and quadratic trends. (d) Make forecasts for three years (2017–2019) using a trend model of your choice. Justify your choice.
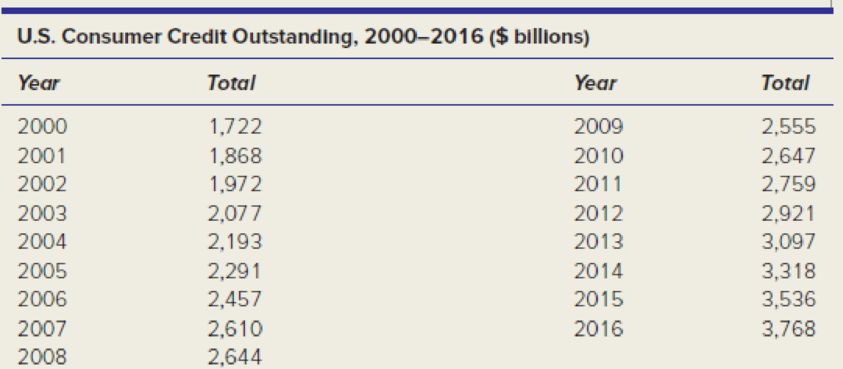
Source: https://www.federalreserve.gov. Data are for December 31 of each year. Units are billions of dollars, seasonally adjusted. Total is short and intermediate term credit to individuals, the sum of revolving credit (mostly credit card and home equity loans) and non-revolving credit (for a specific purchase such as a car, mobile home, education, boats, trailers, or vacations).
Expert Solution & Answer
Want to see the full answer?
Check out a sample textbook solution
Students have asked these similar questions
Write the equation of a trend line.
Use regression analysis to estimate a linear trend line for annual sales.
discuss the trend analysis of the oil palm pricing
Chapter 14 Solutions
Gen Combo Ll Applied Statistics In Business & Economics; Connect Access Card
Ch. 14.2 - (a) Make an Excel graph of the data on the number...Ch. 14.2 - Prob. 3SECh. 14.2 - Prob. 4SECh. 14.2 - Prob. 5SECh. 14.4 - (a) Make an Excel line graph of the exchange rate...Ch. 14.5 - (a) Make an Excel line graph of the following bond...Ch. 14 - Explain the difference between (a) stocks and...Ch. 14 - (a) What is periodicity? (b) Give original...Ch. 14 - (a) What are the distinguishing features of each...Ch. 14 - Name four criteria for assessing a trend forecast.
Ch. 14 - Name two advantages and two disadvantages of each...Ch. 14 - When would the exponential trend model be...Ch. 14 - Explain how to obtain the compound percent growth...Ch. 14 - (a) When might a quadratic model be useful? (b)...Ch. 14 - Name five measures of fit for a trend, and state...Ch. 14 - Prob. 10CRCh. 14 - Prob. 11CRCh. 14 - Prob. 12CRCh. 14 - (a) Why is seasonality irrelevant for annual data?...Ch. 14 - Prob. 14CRCh. 14 - (a) Explain how seasonal binaries can be used to...Ch. 14 - What is the purpose of index numbers?Ch. 14 - (a) Make a line chart for JetBlues revenue. (b)...Ch. 14 - (a) Plot both Swiss watch time series on the same...Ch. 14 - (a) Make a line graph of the U.S. civilian labor...Ch. 14 - (a) Plot the voter participation rate. (b)...Ch. 14 - For each of the following fitted trends, make a...Ch. 14 - (a) Make a line graph of consumer credit...Ch. 14 - (a) Plot the data on U.S. general aviation...Ch. 14 - Prob. 17CECh. 14 - (a) Plot either receipts and outlays or federal...Ch. 14 - Prob. 19CECh. 14 - (a) Plot the data on leisure and hospitality...Ch. 14 - Prob. 21CECh. 14 - Prob. 22CECh. 14 - (a) Plot the data on skier/snowboard visits. (b)...Ch. 14 - Prob. 24CECh. 14 - (a) Plot U.S. petroleum imports on a graph. (b)...Ch. 14 - (a) Make a line chart and fit an m-period moving...Ch. 14 - Refer to exercise 14.26. (a) Plot the dollar/pound...Ch. 14 - (a) Plot the data on natural gas bills. (b) Can...Ch. 14 - (a) Plot the data on air travel delays. (b) Can...Ch. 14 - (a) Plot the data on airplane shipments. (b) Can...Ch. 14 - (a) Plot the data on revolving credit (credit...Ch. 14 - The following seasonal regression was fitted with...Ch. 14 - The following seasonal regression was fitted with...
Knowledge Booster


Learn more about
Need a deep-dive on the concept behind this application? Look no further. Learn more about this topic, statistics and related others by exploring similar questions and additional content below.Similar questions
- Table 6 shows the year and the number ofpeople unemployed in a particular city for several years. Determine whether the trend appears linear. If so, and assuming the trend continues, in what year will the number of unemployed reach 5 people?arrow_forwardThe U.S. Census tracks the percentage of persons 25 years or older who are college graduates. That data forseveral years is given in Table 4[14]. Determine whether the trend appears linear. If so, and assuming the trendcontinues. in what year will the percentage exceed 35%?arrow_forwardHow does one do a trend analysis?arrow_forward
- The following table gives the average monthly exchange rate between the U.S. dollar and the euro for 2009. It shows that 1 euro was equivalent to 1.289 U.S. dollars in January 2009. Develop a trend line that could be used to predict the exchange rate for 2010. Use this model to predict the exchange rate for January 2010 and February 2010. MONTH ______________________ EXCHANGE RATE January ....................................... 1.289 February ...................................... 1.324 March ......................................... 1.321 April .......................................... 1.317 May ........................................... 1.280 June ........................................... 1.254 July ........................................... 1.230 August ....................................... 1.240 September ................................... 1.287 October ..................................... 1.298 November .................................. 1.283 December…arrow_forwardCryptocurrencies have rapidly become an important alternative to traditional currencies for many types of transactions. Etherium, one of the most prominent cryptocurrencies, has rapidly appreciated in value. Daily Etherium trading information for the first 332 days of 2021. It includes the following variables: Date Day – Day of the year, used to assess trend over time Volume (US $) – Daily trading volume Opening Price (US $) – Opening price for daily trading Price Change (US $) – Daily change in price from opening to close 1. Determine the sample correlation coefficient, r, between Volume and Price Change. Test the alternative hypothesis that Volume has a linear relationship to Price Change. Specifically, what are the test statistic and the p-value for that test statistic? For α = .05, what do you conclude about the relationship between the variables? (reminder: the T.DIST.2T function requires input of a positive test statistic)arrow_forwardWhat do the Forecast for each year add up to?arrow_forward
- Edit Amex PLC has gathered following information on the sales of face mask from April 2020 to September 2020. Month Sales ($) April 17,000 May 18,000 June 19,500 July 22,000 August 21,000 September 23,000 You are required to3; a. Using linear trend equation forecast the sales of face masks for October 2020.arrow_forwardfind the equation of the trend linearrow_forwardOnly data that shows positive trends can be graphed in a scatter diagram. True O Falsearrow_forward
- Consider a species that occupies a large, but fixed, number of islands. The distribution of the species across all islands is maintained by a balance between local extinctions and local colonization events. Devise a mathematical model (equation) for the relationship between the fraction of islands occupied by the species and time. Be clear to outline the assumptions you make and be sure to describe your key predictions. Explain what each part of the equation represents.arrow_forwardAS3. NO1. DATA ANALYSISarrow_forward3. Describe the trend (e.g, increase or decrease) Determine whether it shows a linear trend, quadratic trend or exponential trend (e.g. using the first differences, second differences or decay or growth factor)arrow_forward
arrow_back_ios
arrow_forward_ios
Recommended textbooks for you

 Glencoe Algebra 1, Student Edition, 9780079039897...AlgebraISBN:9780079039897Author:CarterPublisher:McGraw Hill
 Big Ideas Math A Bridge To Success Algebra 1: Stu...AlgebraISBN:9781680331141Author:HOUGHTON MIFFLIN HARCOURTPublisher:Houghton Mifflin Harcourt
Glencoe Algebra 1, Student Edition, 9780079039897...
Algebra
ISBN:9780079039897
Author:Carter
Publisher:McGraw Hill
Big Ideas Math A Bridge To Success Algebra 1: Stu...
Algebra
ISBN:9781680331141
Author:HOUGHTON MIFFLIN HARCOURT
Publisher:Houghton Mifflin Harcourt
Time Series Analysis Theory & Uni-variate Forecasting Techniques; Author: Analytics University;https://www.youtube.com/watch?v=_X5q9FYLGxM;License: Standard YouTube License, CC-BY
Operations management 101: Time-series, forecasting introduction; Author: Brandoz Foltz;https://www.youtube.com/watch?v=EaqZP36ool8;License: Standard YouTube License, CC-BY