
Gen Combo Ll Applied Statistics In Business & Economics; Connect Access Card
6th Edition
ISBN: 9781260260632
Author: David Doane, Lori Seward Senior Instructor of Operations Management
Publisher: McGraw-Hill Education
expand_more
expand_more
format_list_bulleted
Videos
Textbook Question
Chapter 14, Problem 10CE
(a) Make a line chart for JetBlue’s revenue. (b) Describe the trend (if any) and discuss possible
causes. (c) Fit both a linear and an exponential trend to the data. (d) Which model is preferred?
Why? (e) Make annual forecasts for 2016–2018, using a trend model of your choice (or a judgment forecast).  JetBlue
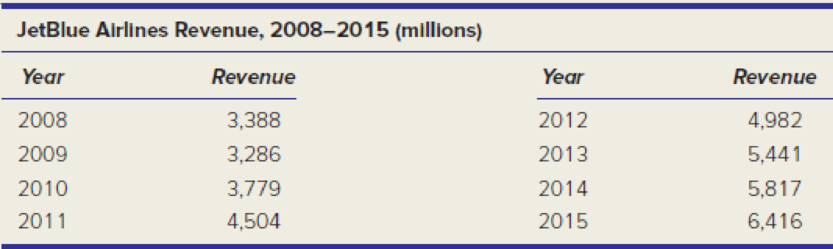
Source: JetBlue’s published annual Form 10-K reports. Data are for December 31 of each year.
Expert Solution & Answer
Want to see the full answer?
Check out a sample textbook solution
Students have asked these similar questions
How does one do a trend analysis?
What do the Forecast for each year add up to?
Cryptocurrencies have rapidly become an important alternative to traditional currencies for many types of transactions. Etherium, one of the most prominent cryptocurrencies, has rapidly appreciated in value. Daily Etherium trading information for the first 332 days of 2021.
It includes the following variables:
Date
Day – Day of the year, used to assess trend over time
Volume (US $) – Daily trading volume
Opening Price (US $) – Opening price for daily trading
Price Change (US $) – Daily change in price from opening to close
1. Determine the sample correlation coefficient, r, between Volume and Price Change. Test the alternative hypothesis that Volume has a linear relationship to Price Change. Specifically, what are the test statistic and the p-value for that test statistic? For α = .05, what do you conclude about the relationship between the variables? (reminder: the T.DIST.2T function requires input of a positive test statistic)
Chapter 14 Solutions
Gen Combo Ll Applied Statistics In Business & Economics; Connect Access Card
Ch. 14.2 - (a) Make an Excel graph of the data on the number...Ch. 14.2 - Prob. 3SECh. 14.2 - Prob. 4SECh. 14.2 - Prob. 5SECh. 14.4 - (a) Make an Excel line graph of the exchange rate...Ch. 14.5 - (a) Make an Excel line graph of the following bond...Ch. 14 - Explain the difference between (a) stocks and...Ch. 14 - (a) What is periodicity? (b) Give original...Ch. 14 - (a) What are the distinguishing features of each...Ch. 14 - Name four criteria for assessing a trend forecast.
Ch. 14 - Name two advantages and two disadvantages of each...Ch. 14 - When would the exponential trend model be...Ch. 14 - Explain how to obtain the compound percent growth...Ch. 14 - (a) When might a quadratic model be useful? (b)...Ch. 14 - Name five measures of fit for a trend, and state...Ch. 14 - Prob. 10CRCh. 14 - Prob. 11CRCh. 14 - Prob. 12CRCh. 14 - (a) Why is seasonality irrelevant for annual data?...Ch. 14 - Prob. 14CRCh. 14 - (a) Explain how seasonal binaries can be used to...Ch. 14 - What is the purpose of index numbers?Ch. 14 - (a) Make a line chart for JetBlues revenue. (b)...Ch. 14 - (a) Plot both Swiss watch time series on the same...Ch. 14 - (a) Make a line graph of the U.S. civilian labor...Ch. 14 - (a) Plot the voter participation rate. (b)...Ch. 14 - For each of the following fitted trends, make a...Ch. 14 - (a) Make a line graph of consumer credit...Ch. 14 - (a) Plot the data on U.S. general aviation...Ch. 14 - Prob. 17CECh. 14 - (a) Plot either receipts and outlays or federal...Ch. 14 - Prob. 19CECh. 14 - (a) Plot the data on leisure and hospitality...Ch. 14 - Prob. 21CECh. 14 - Prob. 22CECh. 14 - (a) Plot the data on skier/snowboard visits. (b)...Ch. 14 - Prob. 24CECh. 14 - (a) Plot U.S. petroleum imports on a graph. (b)...Ch. 14 - (a) Make a line chart and fit an m-period moving...Ch. 14 - Refer to exercise 14.26. (a) Plot the dollar/pound...Ch. 14 - (a) Plot the data on natural gas bills. (b) Can...Ch. 14 - (a) Plot the data on air travel delays. (b) Can...Ch. 14 - (a) Plot the data on airplane shipments. (b) Can...Ch. 14 - (a) Plot the data on revolving credit (credit...Ch. 14 - The following seasonal regression was fitted with...Ch. 14 - The following seasonal regression was fitted with...
Knowledge Booster


Learn more about
Need a deep-dive on the concept behind this application? Look no further. Learn more about this topic, statistics and related others by exploring similar questions and additional content below.Similar questions
- Identify the type of data that would be used when the variable of interest is most-watched TV show.arrow_forwardBriefly describe the principles behind the use of EXTRAPOLATION (TREND) methods of forecasting future water use. Outline the advantages and disadvantages of using this type of methodarrow_forwardCreate a 2-D line chart of Cash Sales for months 1-18. Add a trend line with a forward forecast of 3 periods to the chart. Be sure to include the R-squared value on the chart. Using =TREND(), complete the forecast table for months 19-21 1 $ 2,145,600 19 2 $ 2,175,200 20 3 $ 2,255,200 21 4 $ 2,505,600 5 $ 2,748,800 6 $ 2,358,000 7 $ 3,165,200 8 $ 3,253,600 9 $ 3,484,000 10 $ 3,731,200 11 $ 3,741,200 12 $ 3,558,800 13 $ 3,771,200 14 $ 3,787,600 15 $ 3,813,600 16 $ 3,822,800 17 $ 3,828,000 18 $ 3,897,200arrow_forward
- In this table, x represents the number of years that have passed since 1975. For example, an x-value of 10 represents the year 1985. The letter y represents the profit (or loss), in dollars, for a certain company in that year. Enter the data into a spreadsheet, create a scatterplot and add a trendline. y 4 21.36 5. 23.25 22.74 23.63 8 25.52 9. 25.41 10 27.4 11 26.99 12 28.58 13 32.67 14 30.06 34.25 Use the equation of the trendline to estimate the profit in the year 1995. Round your answer to 1 place after the decimal. Question Help: Message instructor Submit Question MacBookarrow_forwardEditing 2. The table below shows the expected years remainıng in a person's life given a person's cUrrent age. a). Draw a scatter plot and trend line for the data b). Find the equation for the line of best fit for these data c). Use the line of best fit to find the expect years of life remainıng for a person whose current age is 70. d). Do you think your equation will work for any age? Explain. Current Age (years) 10 66.4 30 38.1 29.2 20 60 20.9 17.3 40 50 65 Expected vears of life Remaining 75.2 71.3 56.7 47.3arrow_forwardB and carrow_forward
- The Seneca Children’s Fund (SCF) is a local charity that runs a summer camp for disadvantaged children. The fund’s board of directors has been working very hard over recent years to decrease the amount of overhead expenses, a major factor in how charities are rated by independent agencies. The following data show the percentage of the money SCF has raised that was spent on administrative and fund-raising expenses over the past seven years: Year Period (t) Expense (%) 2003 1 13.9 2004 2 12.2 2005 3 10.5 2006 4 10.4 2007 5 11.5 2008 6 10.0 2009 7 8.5 a. Construct a time series plot. What type of pattern exists in the data?b. Use simple linear regression analysis to find the parameters for the line that minimizes MSE for this time series.c. Forecast the percentage of administrative expenses for year 8.d. If SCF can maintain its current trend in reducing administrative expenses, how long will it take for SCF to achieve a level of 5% or less?arrow_forwardDefine and briefly explain the nature and structure of the following terms. Normality of data.arrow_forwardA bank wanted to find out whether the number of loan applications received are influenced by the current loan interest rate. The manager selected 11 monthly periods for which different interest rates applied and recorded the number of loan applications received. (b) Show the data graphically in a scatter plot. What relationship is observed? SHOW SOLUTION PLEASE!arrow_forward
- Please give correct answer ASAP.arrow_forwardComplete the following: Draw a scatter plot of the data below. b. Draw a trend line. Write its equation Estimate the number of Youtube subscribers in 2030. 5. a. C. Year 2005 2010 2015 2020 Subscribers in Millions 17.7 39.9 54.9 63.0arrow_forwardThe bar graph below shows trends in several economic indicators over the period 2003-2008. Over the six-year period, about what was the highest consumer price index, and when did it occur? Consumer Price Index ILJ -0.5 2003 2004 2005 2006 2007 2008 To the nearest tenth of a percent, the highest consumer price index was occurred in the year %, and itarrow_forward
arrow_back_ios
SEE MORE QUESTIONS
arrow_forward_ios
Recommended textbooks for you
 Glencoe Algebra 1, Student Edition, 9780079039897...AlgebraISBN:9780079039897Author:CarterPublisher:McGraw Hill
 Big Ideas Math A Bridge To Success Algebra 1: Stu...AlgebraISBN:9781680331141Author:HOUGHTON MIFFLIN HARCOURTPublisher:Houghton Mifflin Harcourt
 Holt Mcdougal Larson Pre-algebra: Student Edition...AlgebraISBN:9780547587776Author:HOLT MCDOUGALPublisher:HOLT MCDOUGAL
Glencoe Algebra 1, Student Edition, 9780079039897...
Algebra
ISBN:9780079039897
Author:Carter
Publisher:McGraw Hill
Big Ideas Math A Bridge To Success Algebra 1: Stu...
Algebra
ISBN:9781680331141
Author:HOUGHTON MIFFLIN HARCOURT
Publisher:Houghton Mifflin Harcourt
Holt Mcdougal Larson Pre-algebra: Student Edition...
Algebra
ISBN:9780547587776
Author:HOLT MCDOUGAL
Publisher:HOLT MCDOUGAL
Time Series Analysis Theory & Uni-variate Forecasting Techniques; Author: Analytics University;https://www.youtube.com/watch?v=_X5q9FYLGxM;License: Standard YouTube License, CC-BY
Operations management 101: Time-series, forecasting introduction; Author: Brandoz Foltz;https://www.youtube.com/watch?v=EaqZP36ool8;License: Standard YouTube License, CC-BY