
Gen Combo Ll Applied Statistics In Business & Economics; Connect Access Card
6th Edition
ISBN: 9781260260632
Author: David Doane, Lori Seward Senior Instructor of Operations Management
Publisher: McGraw-Hill Education
expand_more
expand_more
format_list_bulleted
Videos
Textbook Question
Chapter 14.4, Problem 6SE
(a) Make an Excel line graph of the exchange rate data. Describe the pattern. (b) Click on the data and choose Add Trendline > Moving Average. Describe the effect of increasing m (e.g., m = 2, 4, 6, etc.). Include a copy of each graph with your answer. (c) Discuss how this moving average might help a currency speculator.
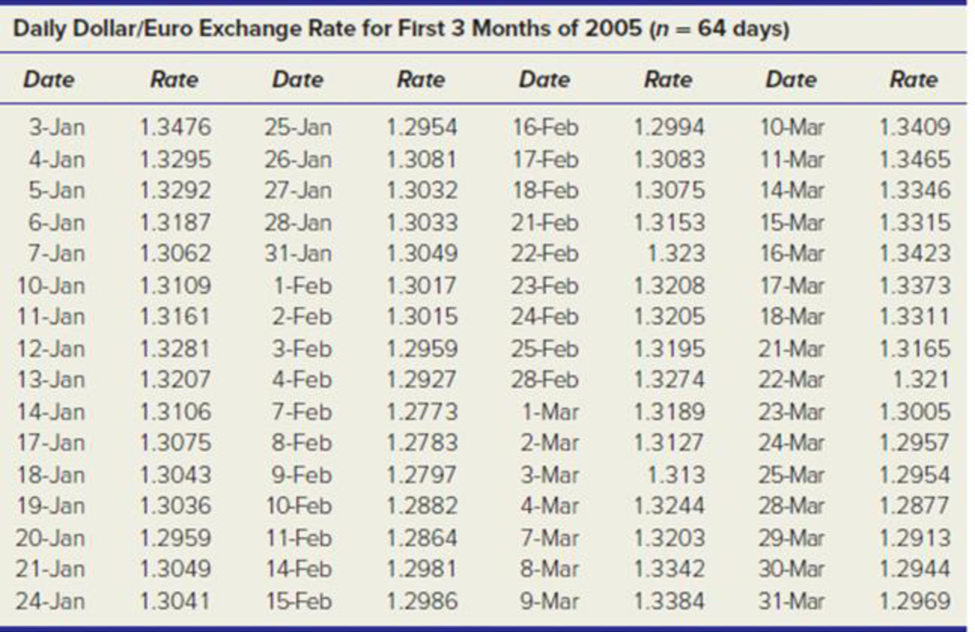
Source: www.federalreserve.gov.
Expert Solution & Answer

Trending nowThis is a popular solution!

Students have asked these similar questions
The accompanying table displays information about the number of births (in thousands) and the number of deaths (in thousands) for certain years. Report the death rate as a percentage of the birth rate, and comment on its trend over time. What is causing the trend?
LOADING...
Click the icon to view the data table.
Report each death rate as a percentage of the birth rate.
Year
Births
(thousands)
Deaths
(thousands)
Percentage of deaths per births
2006
4275
2445
nothing%
2007
4320
2408
nothing%
2008
4241
2465
nothing%
2009
4140
2436
nothing%
2010
4002
2455
nothing%
(Round to one decimal place as needed.)
The following scatterplot shows the relationship between a house's area (in square feet) and its acreage, or the area of its lot. Explain the trend in context of the
graph.
Scatterplot of Acreage vs Area
500
1000
1500
2000
2500
3000
3500
Area (in square feet)
Aareage
The following scatterplot shows the relationship between a house's area (in square feet) and its acreage, or the area of its lot. Explain the trend in context of the graph.
Scatterplot of Acreage vs Area
500
1000
1500
2000
2500
3000
3500
Area (in square feet)
. ALTIENIC10 (Mac)
Acreage
Chapter 14 Solutions
Gen Combo Ll Applied Statistics In Business & Economics; Connect Access Card
Ch. 14.2 - (a) Make an Excel graph of the data on the number...Ch. 14.2 - Prob. 3SECh. 14.2 - Prob. 4SECh. 14.2 - Prob. 5SECh. 14.4 - (a) Make an Excel line graph of the exchange rate...Ch. 14.5 - (a) Make an Excel line graph of the following bond...Ch. 14 - Explain the difference between (a) stocks and...Ch. 14 - (a) What is periodicity? (b) Give original...Ch. 14 - (a) What are the distinguishing features of each...Ch. 14 - Name four criteria for assessing a trend forecast.
Ch. 14 - Name two advantages and two disadvantages of each...Ch. 14 - When would the exponential trend model be...Ch. 14 - Explain how to obtain the compound percent growth...Ch. 14 - (a) When might a quadratic model be useful? (b)...Ch. 14 - Name five measures of fit for a trend, and state...Ch. 14 - Prob. 10CRCh. 14 - Prob. 11CRCh. 14 - Prob. 12CRCh. 14 - (a) Why is seasonality irrelevant for annual data?...Ch. 14 - Prob. 14CRCh. 14 - (a) Explain how seasonal binaries can be used to...Ch. 14 - What is the purpose of index numbers?Ch. 14 - (a) Make a line chart for JetBlues revenue. (b)...Ch. 14 - (a) Plot both Swiss watch time series on the same...Ch. 14 - (a) Make a line graph of the U.S. civilian labor...Ch. 14 - (a) Plot the voter participation rate. (b)...Ch. 14 - For each of the following fitted trends, make a...Ch. 14 - (a) Make a line graph of consumer credit...Ch. 14 - (a) Plot the data on U.S. general aviation...Ch. 14 - Prob. 17CECh. 14 - (a) Plot either receipts and outlays or federal...Ch. 14 - Prob. 19CECh. 14 - (a) Plot the data on leisure and hospitality...Ch. 14 - Prob. 21CECh. 14 - Prob. 22CECh. 14 - (a) Plot the data on skier/snowboard visits. (b)...Ch. 14 - Prob. 24CECh. 14 - (a) Plot U.S. petroleum imports on a graph. (b)...Ch. 14 - (a) Make a line chart and fit an m-period moving...Ch. 14 - Refer to exercise 14.26. (a) Plot the dollar/pound...Ch. 14 - (a) Plot the data on natural gas bills. (b) Can...Ch. 14 - (a) Plot the data on air travel delays. (b) Can...Ch. 14 - (a) Plot the data on airplane shipments. (b) Can...Ch. 14 - (a) Plot the data on revolving credit (credit...Ch. 14 - The following seasonal regression was fitted with...Ch. 14 - The following seasonal regression was fitted with...
Knowledge Booster


Learn more about
Need a deep-dive on the concept behind this application? Look no further. Learn more about this topic, statistics and related others by exploring similar questions and additional content below.Similar questions
- The scatterplot below shows the sales for a flower company for the years 2007 through 2012. Use a trend line to determine the year the sales will reach about $450,000. Flower Sales 350 250 200 100 Year Sales (in thousands)arrow_forwardUsing the accompanying Student Grades data, construct a scatter chart for midterm versus final exam grades and add a linear trendline. What is the model? If a student scores 70 on the midterm, what would you predict her grade on the final exam to be? Click the icon to view the Student Grades data. Choose the correct scatter chart and linear trendline for the data. Click here to view chart b. Click here to view chart d Click here to view chart a Click here to view chart c What is the model for the trendline? Final Exam Grade = =+xMidterm Grade (Round to three decimal places as needed.) Final Chart b 1201 100- 80- 60- 40- 20- 0+ 50 60 70 80 90 100 110 Midterm - - Xarrow_forwardThe graph below is a scatter plot between liabilities and assets, bothexpressed in millions. i. Critically assess this scatter plot explaining about the relationship betweentwo variables.ii. A researcher claims that the correlation is showing that changes in assetscause changes in liabilities. Is he right or wrong? Explain your answer.arrow_forward
- Create a line graph of the data using Excel. For how many of the years was the deficit greater than or equal to $320 million?arrow_forwardI am not able to see the percent tablearrow_forwarddraw a line graph following this information. The line graph depicts the historical and projected sales volume of Pepsi Co Jamaica's Diet Pepsi for the next fiscal year, with the horizontal axis representing the four quarters of the year, and the vertical axis representing the sales volume in million cases. The historical sales data is represented by a line that shows a sales volume of 1 million cases for the past fiscal year. The projected sales volume is represented by another line that shows an expected increase in sales volume to 1.5 million cases for the next fiscal year. The sales targets for each quarter are represented by markers or points on the graph, with the first quarter expected to reach 0.4 million cases, the second quarter at 0.5 million cases, the third quarter at 0.3 million cases, and the fourth quarter at 0.3 million cases.arrow_forward
- The following table gives the average monthly exchange rate between the U.S. dollar and the euro for 2009. It shows that 1 euro was equivalent to 1.289 U.S. dollars in January 2009. Develop a trend line that could be used to predict the exchange rate for 2010. Use this model to predict the exchange rate for January 2010 and February 2010. MONTH ______________________ EXCHANGE RATE January ....................................... 1.289 February ...................................... 1.324 March ......................................... 1.321 April .......................................... 1.317 May ........................................... 1.280 June ........................................... 1.254 July ........................................... 1.230 August ....................................... 1.240 September ................................... 1.287 October ..................................... 1.298 November .................................. 1.283 December…arrow_forwardSo I'll include a line graph for a second visual aid. I have a chart to show the proportion of students by major that have student loan debt at our school.arrow_forwardSelect your answers from the drop-down lists.arrow_forward
- Determine the equation of the trend line for the data shown below on Canadian balance of payments for exports of wheat over a five-year period provided by Statistics Canada. Using the trend line equation, forecast the value for the year 2014. Calculate the slope, intercept and the forecast 1. using the formulas 2. using the functions Year Export-Balance of Payments (Unadjusted) -Wheat ($ millions) 2008 569.2 2009 480.8 2010 365.7 2011 471 2012 508.6 By formula By Function SLOPE INTERCEPT FORECAST Please provide calculation in excel with step by step process for me to follow . thank youarrow_forwardThe bar graph gives the average atmospheric concentration of carbon dioxide. a. Estimate the yearly increase in the average atmospheric concentration of carbon dioxide. Express the answer in parts per million. b. Write a mathematical model that estimates the average atmospheric concentration of carbon dioxide, C, in parts per million, x years after 1950. c. If the trend shown by the data continues, use your mathematical model from part (b) to project the average atmospheric concentration of carbon dioxide in 2030. Average Atmospheric Concentration of Carbon Dioxide 500- 314 320 329 341 354 368 389 397 300- 400- 200- 100- 19501960 197019801990200020102015 a. The yearly increase in the average atmospheric concentration of carbon dioxide is approximately ppm per year. (Round to the nearest tenth as needed.) b. A mathematical model that estimates the average atmospheric concentration of carbon dioxide, C, in parts per million, x years after 1950 is C = (Use integers or decimals for any…arrow_forwardSee uploaded picture for question.arrow_forward
arrow_back_ios
SEE MORE QUESTIONS
arrow_forward_ios
Recommended textbooks for you
 Glencoe Algebra 1, Student Edition, 9780079039897...AlgebraISBN:9780079039897Author:CarterPublisher:McGraw Hill
 Big Ideas Math A Bridge To Success Algebra 1: Stu...AlgebraISBN:9781680331141Author:HOUGHTON MIFFLIN HARCOURTPublisher:Houghton Mifflin Harcourt
 Holt Mcdougal Larson Pre-algebra: Student Edition...AlgebraISBN:9780547587776Author:HOLT MCDOUGALPublisher:HOLT MCDOUGAL
Glencoe Algebra 1, Student Edition, 9780079039897...
Algebra
ISBN:9780079039897
Author:Carter
Publisher:McGraw Hill
Big Ideas Math A Bridge To Success Algebra 1: Stu...
Algebra
ISBN:9781680331141
Author:HOUGHTON MIFFLIN HARCOURT
Publisher:Houghton Mifflin Harcourt
Holt Mcdougal Larson Pre-algebra: Student Edition...
Algebra
ISBN:9780547587776
Author:HOLT MCDOUGAL
Publisher:HOLT MCDOUGAL
Time Series Analysis Theory & Uni-variate Forecasting Techniques; Author: Analytics University;https://www.youtube.com/watch?v=_X5q9FYLGxM;License: Standard YouTube License, CC-BY
Operations management 101: Time-series, forecasting introduction; Author: Brandoz Foltz;https://www.youtube.com/watch?v=EaqZP36ool8;License: Standard YouTube License, CC-BY