
Gen Combo Ll Applied Statistics In Business & Economics; Connect Access Card
6th Edition
ISBN: 9781260260632
Author: David Doane, Lori Seward Senior Instructor of Operations Management
Publisher: McGraw-Hill Education
expand_more
expand_more
format_list_bulleted
Videos
Textbook Question
Chapter 14, Problem 18CE
(a) Plot either receipts and outlays or federal debt and GDP (plot both time series on the same graph). (b) Describe the two trends and discuss possible causes. (c) Fit an exponential trend to each. (d) Compare the growth rates. Explain the implications. (e*) Calculate and plot the ratio of debt to GDP. What does it show?
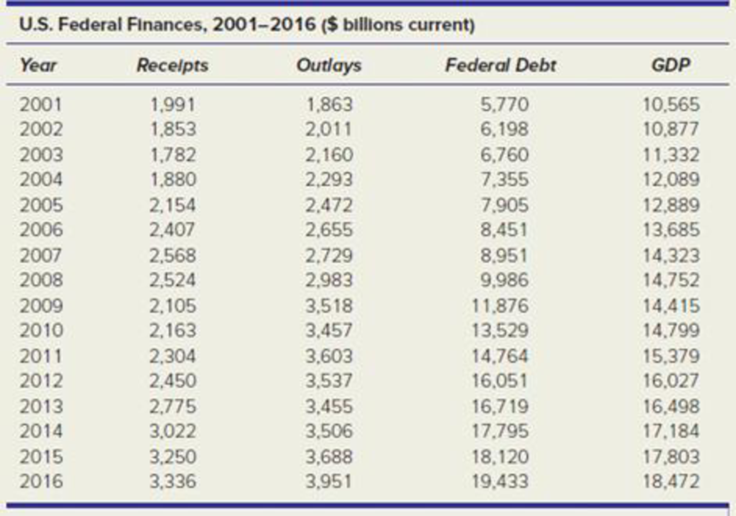
Source: Economic Report of the President, 2016.
Expert Solution & Answer
Want to see the full answer?
Check out a sample textbook solution
Students have asked these similar questions
In the last three years, there have been changes of 55%, 3% and 2% in the production amount of a good, respectively. What is the geometric mean of the annual rate of change?
c. Predict sales in 15 years.
Which formula can be used to estimate the annual investment?
Chapter 14 Solutions
Gen Combo Ll Applied Statistics In Business & Economics; Connect Access Card
Ch. 14.2 - (a) Make an Excel graph of the data on the number...Ch. 14.2 - Prob. 3SECh. 14.2 - Prob. 4SECh. 14.2 - Prob. 5SECh. 14.4 - (a) Make an Excel line graph of the exchange rate...Ch. 14.5 - (a) Make an Excel line graph of the following bond...Ch. 14 - Explain the difference between (a) stocks and...Ch. 14 - (a) What is periodicity? (b) Give original...Ch. 14 - (a) What are the distinguishing features of each...Ch. 14 - Name four criteria for assessing a trend forecast.
Ch. 14 - Name two advantages and two disadvantages of each...Ch. 14 - When would the exponential trend model be...Ch. 14 - Explain how to obtain the compound percent growth...Ch. 14 - (a) When might a quadratic model be useful? (b)...Ch. 14 - Name five measures of fit for a trend, and state...Ch. 14 - Prob. 10CRCh. 14 - Prob. 11CRCh. 14 - Prob. 12CRCh. 14 - (a) Why is seasonality irrelevant for annual data?...Ch. 14 - Prob. 14CRCh. 14 - (a) Explain how seasonal binaries can be used to...Ch. 14 - What is the purpose of index numbers?Ch. 14 - (a) Make a line chart for JetBlues revenue. (b)...Ch. 14 - (a) Plot both Swiss watch time series on the same...Ch. 14 - (a) Make a line graph of the U.S. civilian labor...Ch. 14 - (a) Plot the voter participation rate. (b)...Ch. 14 - For each of the following fitted trends, make a...Ch. 14 - (a) Make a line graph of consumer credit...Ch. 14 - (a) Plot the data on U.S. general aviation...Ch. 14 - Prob. 17CECh. 14 - (a) Plot either receipts and outlays or federal...Ch. 14 - Prob. 19CECh. 14 - (a) Plot the data on leisure and hospitality...Ch. 14 - Prob. 21CECh. 14 - Prob. 22CECh. 14 - (a) Plot the data on skier/snowboard visits. (b)...Ch. 14 - Prob. 24CECh. 14 - (a) Plot U.S. petroleum imports on a graph. (b)...Ch. 14 - (a) Make a line chart and fit an m-period moving...Ch. 14 - Refer to exercise 14.26. (a) Plot the dollar/pound...Ch. 14 - (a) Plot the data on natural gas bills. (b) Can...Ch. 14 - (a) Plot the data on air travel delays. (b) Can...Ch. 14 - (a) Plot the data on airplane shipments. (b) Can...Ch. 14 - (a) Plot the data on revolving credit (credit...Ch. 14 - The following seasonal regression was fitted with...Ch. 14 - The following seasonal regression was fitted with...
Knowledge Booster


Learn more about
Need a deep-dive on the concept behind this application? Look no further. Learn more about this topic, statistics and related others by exploring similar questions and additional content below.Similar questions
- Table 6 shows the year and the number ofpeople unemployed in a particular city for several years. Determine whether the trend appears linear. If so, and assuming the trend continues, in what year will the number of unemployed reach 5 people?arrow_forwardThe U.S. Census tracks the percentage of persons 25 years or older who are college graduates. That data forseveral years is given in Table 4[14]. Determine whether the trend appears linear. If so, and assuming the trendcontinues. in what year will the percentage exceed 35%?arrow_forwardThe US. import of wine (in hectoliters) for several years is given in Table 5. Determine whether the trend appearslinear. Ifso, and assuming the trend continues, in what year will imports exceed 12,000 hectoliters?arrow_forward
- Siena Ltd attempts to find the trend of its sales over the past five years. Siena is considering which model that best represent the trends of its sales. Following are the result of linear and exponential model trend analysis: a. Calculate the MSE and MAD for the linear trend model b. Calculate the MSE and MAD for the exponential trend model c. Which model that performs betterarrow_forwardYear Annual CPI 2010 218.056 2000 172.200 1990 130.700 1980 82.400 Jennifer Marlowe was making $43,276 in 1980. Use the CPI table to determine what her salary would be in 2010, if it kept up with inflation since 1980. Round answer to the nearest dollar, do not include $ in your answer.arrow_forwardSuppose you needed $0.27 to buy a particular box of macaroni and cheese in 1977.How much would it cost to buy the same box of macaroni and cheese in 2003?Assume that all prices have risen at the same rate as the CPI. uestion content area bottom left Part 1 How much would it cost? Average Annual Consumer Price Index (CPI) (1982-1984=100) Year CPI Year CPI Year CPI 1976 56.9 1989 124.0 2001 177.1 1977 60.6 1990 130.7 2002 179.9 1978 65.2 1991 136.2 2003 184.0 1979 72.6 1992 140.3 2004 188.9 1980 82.4 1993 144.5 2005 195.3 1981 90.9 1994 148.2 2006 201.6 1982 96.5 1995 152.4 2007 207.3 1983 99.6 1996 156.9 2008 215.3 1984 103.9 1997 160.5 2009 214.5 1985 107.6 1998 163.0 2010 218.1 1986 109.6 1999 166.6 2011 224.9 1987 113.6 2000 172.2 2012 229.6 1988 118.3arrow_forward
- arget's annual revenue data from 2005 to 2021 are available for download. Make an Excel graph of the annual data, and fit three trends (linear, quadratic, and exponential) to the time series. Copy and paste the graph in the space below or attach the file. State the three trendline equations from part a and their R2 values. Which trend model do you think is the best one to use to forecast annual revenue? Choose only one model and explain the reasons for your choice. Use the model you chose in part c to forecast the annual revenue for 2022. Annual Operating Income Year t (Millions of US $) 2005 1 46839 2006 2 52620 2007 3 59490 2008 4 63367 2009 5 64948 2010 6 65357 2011 7 67390 2012 8 69865 2013 9 73301 2014 10 71279 2015 11 72618 2016 12 73785 2017 13 70271 2018 14 72714 2019 15 75356 2020 16 78112 2021 17 93561arrow_forwardPrincipal (p) = 1500, Rate (r) = 7%, Time (t) = 8 years. Calculate the Internet.arrow_forwardMy Courses PV Years Percent Compound FV $656,003.10 50 4.33% Monthly O a. $2,076,249.81 Ob. $5,462,183.18 Oc.$5,586,243.03 O d. $5,694,572.83arrow_forward
- Find the MSE in part (b) please.arrow_forwardA company's total sales (in millions of dollars) t months from now are given by S(t) = 0.03³ +0.5t² + 2t +3arrow_forwardFill in the missing information in the following table. Assume that Portfolio AB is 50 percent invested in Stock A. (A negative value should be indicated by a minus sign. Do not round intermediate calculations. Enter your answers as a percent rounded to 2 decimal places.) Annual Returns on Stocks A and B Year Stock A Stock B Portfolio AB 2015 11.5 % 21.5 % % 2016 36.8 % -37.7 % % 2017 -20.6 % 47.7 % % 2018 25.9 % 16.1 % % 2019 13.2 % 24.3 % % Average return 13.36 % % % Standard deviation % % %arrow_forward
arrow_back_ios
SEE MORE QUESTIONS
arrow_forward_ios
Recommended textbooks for you
 College AlgebraAlgebraISBN:9781305115545Author:James Stewart, Lothar Redlin, Saleem WatsonPublisher:Cengage Learning
 Holt Mcdougal Larson Pre-algebra: Student Edition...AlgebraISBN:9780547587776Author:HOLT MCDOUGALPublisher:HOLT MCDOUGAL
 Glencoe Algebra 1, Student Edition, 9780079039897...AlgebraISBN:9780079039897Author:CarterPublisher:McGraw Hill
 Big Ideas Math A Bridge To Success Algebra 1: Stu...AlgebraISBN:9781680331141Author:HOUGHTON MIFFLIN HARCOURTPublisher:Houghton Mifflin Harcourt
 Algebra and Trigonometry (MindTap Course List)AlgebraISBN:9781305071742Author:James Stewart, Lothar Redlin, Saleem WatsonPublisher:Cengage Learning
College Algebra
Algebra
ISBN:9781305115545
Author:James Stewart, Lothar Redlin, Saleem Watson
Publisher:Cengage Learning
Holt Mcdougal Larson Pre-algebra: Student Edition...
Algebra
ISBN:9780547587776
Author:HOLT MCDOUGAL
Publisher:HOLT MCDOUGAL
Glencoe Algebra 1, Student Edition, 9780079039897...
Algebra
ISBN:9780079039897
Author:Carter
Publisher:McGraw Hill
Big Ideas Math A Bridge To Success Algebra 1: Stu...
Algebra
ISBN:9781680331141
Author:HOUGHTON MIFFLIN HARCOURT
Publisher:Houghton Mifflin Harcourt
Algebra and Trigonometry (MindTap Course List)
Algebra
ISBN:9781305071742
Author:James Stewart, Lothar Redlin, Saleem Watson
Publisher:Cengage Learning
Time Series Analysis Theory & Uni-variate Forecasting Techniques; Author: Analytics University;https://www.youtube.com/watch?v=_X5q9FYLGxM;License: Standard YouTube License, CC-BY
Operations management 101: Time-series, forecasting introduction; Author: Brandoz Foltz;https://www.youtube.com/watch?v=EaqZP36ool8;License: Standard YouTube License, CC-BY