
Videos
House Prices (Example 10) Figure A contains the selling price and area (in square feet) of 81 recently sold homes in a region where a buyer wants to purchase a home.
a. Use the equation to estimate the price of a home with 2500 square feet.
b. The buyer wants to know the uncertainty in the prices he might pay for a home with 2500 square feet in this region. Should he use a prediction interval or a confidence interval? Explain.
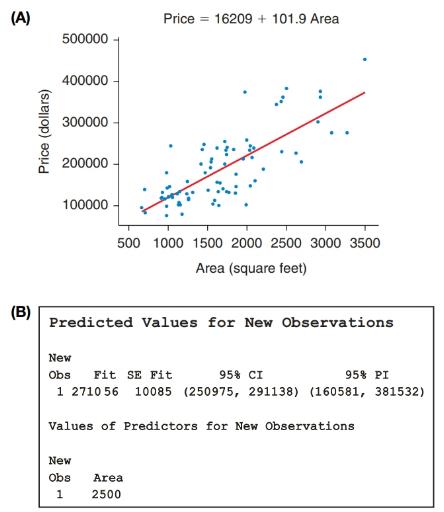
c. Report the correct 95% interval, confidence or prediction as determined in part b, for the predicted price. See Figure B.
d. The buyer has prequalified for a loan up to
Want to see the full answer?
Check out a sample textbook solution
Chapter 14 Solutions
EP INTRODUCTORY STATISTICS-MYSTATLAB
Additional Math Textbook Solutions
Research Methods for the Behavioral Sciences (MindTap Course List)
Statistical Techniques in Business and Economics
Basic Business Statistics, Student Value Edition
Elementary Statistics Using Excel (6th Edition)
STATISTICS F/BUSINESS+ECONOMICS-TEXT


 Glencoe Algebra 1, Student Edition, 9780079039897...AlgebraISBN:9780079039897Author:CarterPublisher:McGraw Hill
 Big Ideas Math A Bridge To Success Algebra 1: Stu...AlgebraISBN:9781680331141Author:HOUGHTON MIFFLIN HARCOURTPublisher:Houghton Mifflin Harcourt
 Holt Mcdougal Larson Pre-algebra: Student Edition...AlgebraISBN:9780547587776Author:HOLT MCDOUGALPublisher:HOLT MCDOUGAL