
EP INTRODUCTORY STATISTICS-MYSTATLAB
3rd Edition
ISBN: 9780135190210
Author: Gould
Publisher: PEARSON CO
expand_more
expand_more
format_list_bulleted
Concept explainers
Videos
Textbook Question
Chapter 14, Problem 11SE
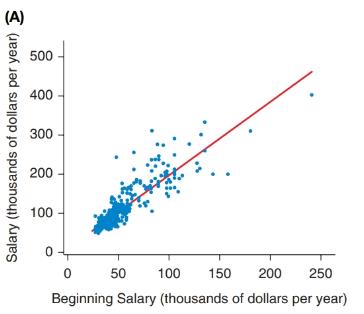
Salaries Figure A shows a
Expert Solution & Answer
Want to see the full answer?
Check out a sample textbook solution
Chapter 14 Solutions
EP INTRODUCTORY STATISTICS-MYSTATLAB
Ch. 14 - Predicting Test Scores A professor tells his class...Ch. 14 - Used-Car Values A student wishes to buy a used...Ch. 14 - Height and Age (Example 1) A doctor says he can...Ch. 14 - Units and Semesters The registrar at a small...Ch. 14 - Prob. 5SECh. 14 - Prob. 6SECh. 14 - Prob. 7SECh. 14 - Prob. 8SECh. 14 - Semesters and Credits (Example 4) Figure A shows a...Ch. 14 - Prob. 10SE
Ch. 14 - Salaries Figure A shows a scatterplot of the...Ch. 14 - Prob. 12SECh. 14 - Wages of Twins Figure A shows a scatterplot of...Ch. 14 - Simulated Data Figure A shows a scatterplot of...Ch. 14 - Prob. 15SECh. 14 - Movie Budgets Do movies with bigger budgets tend...Ch. 14 - Education of Parents (Example 7) Each of 29...Ch. 14 - Education of Parents Refer to exercise 14.17 and...Ch. 14 - Student and Parent Heights A random sample of 29...Ch. 14 - Trash The weight of trash (in pounds) produced by...Ch. 14 - Prob. 21SECh. 14 - Prob. 22SECh. 14 - Trash and Confidence Intervals The output provided...Ch. 14 - Movie Budgets In exercise 14.16 you examined the...Ch. 14 - Predicted GPA A student who has been accepted by...Ch. 14 - Used BMWs A used-car dealer is purchasing 50 used...Ch. 14 - Predicted Height (Example 9) A mother wants to...Ch. 14 - Predicted GPA A dean of students at a college...Ch. 14 - Loggers A logging company has the diameter of each...Ch. 14 - Prob. 30SECh. 14 - House Prices (Example 10) Figure A contains the...Ch. 14 - Math SAT Score and GPA Figure A shows information...Ch. 14 - Height and Weight A scatterplot of the heights and...Ch. 14 - Waist Size and Weight A scatterplot of the waist...Ch. 14 - GPA and SAT The figure shows 95#37; prediction...Ch. 14 - Shoes and Heights The scatterplot shows shoe size...Ch. 14 - Height and Weight A scatterplot of the heights and...Ch. 14 - Waist Size and Weight A scatterplot of the waist...Ch. 14 - Baseball Players Figure A shows a scatterplot with...Ch. 14 - Predicting Education Figure A shows a scatterplot...Ch. 14 - Life Expectancy and Gestation Periods for Animals...Ch. 14 - Prob. 42CRE
Additional Math Textbook Solutions
Find more solutions based on key concepts
1. How is a sample related to a population?
Elementary Statistics: Picturing the World (6th Edition)
How much time do Americans living in or near cities spend waiting in traffic, and how much does waiting in traf...
Business Statistics: A First Course (7th Edition)
Four different beverages are sold at a fast-food restaurant: soft drinks, tea, coffee, and bottled water. a. Ex...
Basic Business Statistics, Student Value Edition
In a test of the quality of two television commercials, each commercial was shown in a separate test area six t...
Statistics for Business & Economics, Revised (MindTap Course List)
UW Student survey In a University of Wisconsin (UW) study about alcohol abuse among students, 100 of the 40,858...
Statistics: The Art and Science of Learning from Data (4th Edition)
Knowledge Booster


Learn more about
Need a deep-dive on the concept behind this application? Look no further. Learn more about this topic, statistics and related others by exploring similar questions and additional content below.Similar questions
- Find the equation of the regression line for the following data set. x 1 2 3 y 0 3 4arrow_forwardWhat is regression analysis? Describe the process of performing regression analysis on a graphing utility.arrow_forwardLife Expectancy The following table shows the average life expectancy, in years, of a child born in the given year42 Life expectancy 2005 77.6 2007 78.1 2009 78.5 2011 78.7 2013 78.8 a. Find the equation of the regression line, and explain the meaning of its slope. b. Plot the data points and the regression line. c. Explain in practical terms the meaning of the slope of the regression line. d. Based on the trend of the regression line, what do you predict as the life expectancy of a child born in 2019? e. Based on the trend of the regression line, what do you predict as the life expectancy of a child born in 1580?2300arrow_forward
- Demand for Candy Bars In this problem you will determine a linear demand equation that describes the demand for candy bars in your class. Survey your classmates to determine what price they would be willing to pay for a candy bar. Your survey form might look like the sample to the left. a Make a table of the number of respondents who answered yes at each price level. b Make a scatter plot of your data. c Find and graph the regression line y=mp+b, which gives the number of respondents y who would buy a candy bar if the price were p cents. This is the demand equation. Why is the slope m negative? d What is the p-intercept of the demand equation? What does this intercept tell you about pricing candy bars? Would you buy a candy bar from the vending machine in the hallway if the price is as indicated. Price Yes or No 50 75 1.00 1.25 1.50 1.75 2.00arrow_forwardDoes Table 1 represent a linear function? If so, finda linear equation that models the data.arrow_forward
arrow_back_ios
arrow_forward_ios
Recommended textbooks for you

 Functions and Change: A Modeling Approach to Coll...AlgebraISBN:9781337111348Author:Bruce Crauder, Benny Evans, Alan NoellPublisher:Cengage Learning
 Glencoe Algebra 1, Student Edition, 9780079039897...AlgebraISBN:9780079039897Author:CarterPublisher:McGraw Hill
 Trigonometry (MindTap Course List)TrigonometryISBN:9781305652224Author:Charles P. McKeague, Mark D. TurnerPublisher:Cengage Learning
 Calculus For The Life SciencesCalculusISBN:9780321964038Author:GREENWELL, Raymond N., RITCHEY, Nathan P., Lial, Margaret L.Publisher:Pearson Addison Wesley,
Functions and Change: A Modeling Approach to Coll...
Algebra
ISBN:9781337111348
Author:Bruce Crauder, Benny Evans, Alan Noell
Publisher:Cengage Learning
Glencoe Algebra 1, Student Edition, 9780079039897...
Algebra
ISBN:9780079039897
Author:Carter
Publisher:McGraw Hill
Trigonometry (MindTap Course List)
Trigonometry
ISBN:9781305652224
Author:Charles P. McKeague, Mark D. Turner
Publisher:Cengage Learning
Calculus For The Life Sciences
Calculus
ISBN:9780321964038
Author:GREENWELL, Raymond N., RITCHEY, Nathan P., Lial, Margaret L.
Publisher:Pearson Addison Wesley,
Correlation Vs Regression: Difference Between them with definition & Comparison Chart; Author: Key Differences;https://www.youtube.com/watch?v=Ou2QGSJVd0U;License: Standard YouTube License, CC-BY
Correlation and Regression: Concepts with Illustrative examples; Author: LEARN & APPLY : Lean and Six Sigma;https://www.youtube.com/watch?v=xTpHD5WLuoA;License: Standard YouTube License, CC-BY