
Concept explainers
Videos
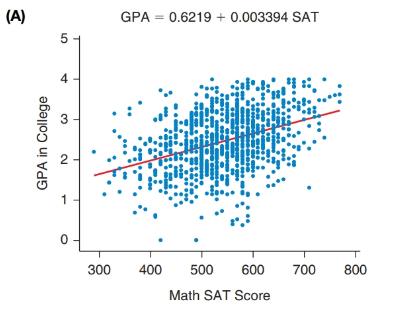
Math SAT Score and GPA Figure A shows information about a random sample of students’ math SAT scores and GPAs at an unidentified four-year college.
a. Use the formula on the graph to predict the GPA for a person with a math SAT score of 600.
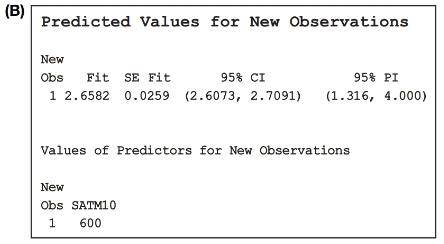
b. Figure B shows both a prediction interval and a confidence interval for a new SAT of 600; report both.
c. One student wants to estimate the GPA he will achieve if he attends that school. Should he use the prediction interval or the confidence interval? Explain.
d. Report the interval obtained for part c. Is it very useful? Explain.
Want to see the full answer?
Check out a sample textbook solution
Chapter 14 Solutions
EP INTRODUCTORY STATISTICS-MYSTATLAB
Additional Math Textbook Solutions
Statistics for Business and Economics (13th Edition)
Intro Stats, Books a la Carte Edition (5th Edition)
Introductory Statistics
Statistics Through Applications
Statistics: The Art and Science of Learning from Data (4th Edition)
Introduction to Statistical Quality Control


 Glencoe Algebra 1, Student Edition, 9780079039897...AlgebraISBN:9780079039897Author:CarterPublisher:McGraw Hill
 Big Ideas Math A Bridge To Success Algebra 1: Stu...AlgebraISBN:9781680331141Author:HOUGHTON MIFFLIN HARCOURTPublisher:Houghton Mifflin Harcourt
 Holt Mcdougal Larson Pre-algebra: Student Edition...AlgebraISBN:9780547587776Author:HOLT MCDOUGALPublisher:HOLT MCDOUGAL