
Concept explainers
Videos
Predicting Education Figure A shows a
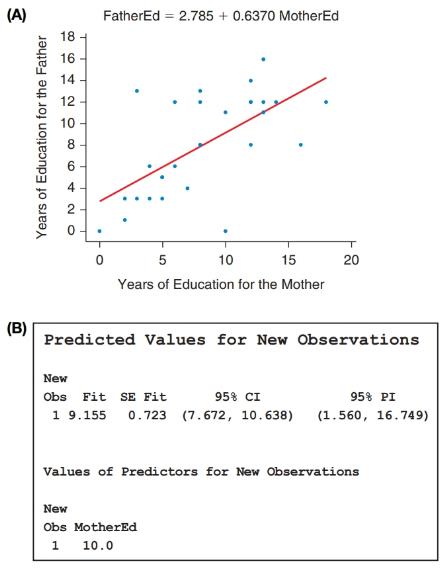
a. Identify which interval is which. Explain what they show and why one interval is larger than the other.
b. Interpret the confidence interval.
c. Interpret the prediction interval.
Want to see the full answer?
Check out a sample textbook solution
Chapter 14 Solutions
EP INTRODUCTORY STATISTICS-MYSTATLAB
Additional Math Textbook Solutions
APPLIED STAT.IN BUS.+ECONOMICS
Statistics for Psychology
Elementary Statistics ( 3rd International Edition ) Isbn:9781260092561
Essentials of Statistics, Books a la Carte Edition (5th Edition)
Elementary Statistics: Picturing the World (6th Edition)
Developmental Mathematics (9th Edition)


 Calculus For The Life SciencesCalculusISBN:9780321964038Author:GREENWELL, Raymond N., RITCHEY, Nathan P., Lial, Margaret L.Publisher:Pearson Addison Wesley,
 Glencoe Algebra 1, Student Edition, 9780079039897...AlgebraISBN:9780079039897Author:CarterPublisher:McGraw Hill
 Big Ideas Math A Bridge To Success Algebra 1: Stu...AlgebraISBN:9781680331141Author:HOUGHTON MIFFLIN HARCOURTPublisher:Houghton Mifflin Harcourt
 Holt Mcdougal Larson Pre-algebra: Student Edition...AlgebraISBN:9780547587776Author:HOLT MCDOUGALPublisher:HOLT MCDOUGAL