
Videos
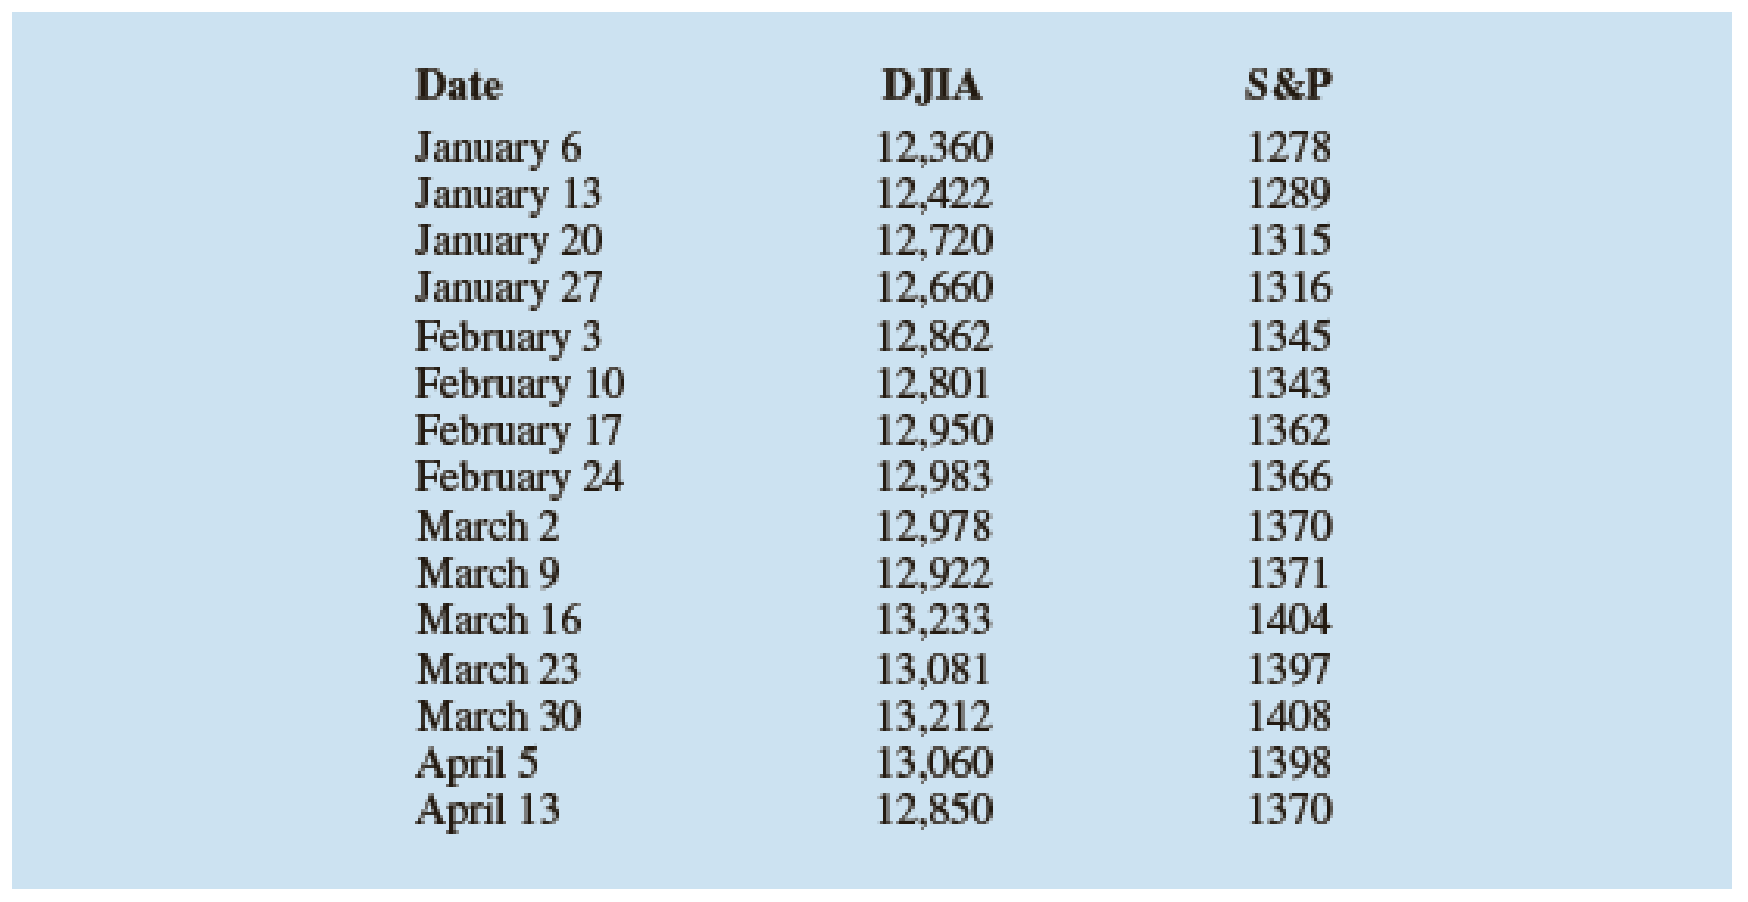
The Dow Jones Industrial Average (DJIA) and the Standard & Poor’s 500 (S&P 500) indexes are used as measures of overall movement in the stock market. The DJIA is based on the price movements of 30 large companies; the S&P 500 is an index composed of 500 stocks. Some say the S&P 500 is a better measure of stock market performance because it is broader based. The closing price for the DJIA and the S&P 500 for 15 weeks, beginning with January 6, 2012, follow (Barron’s website, April 17, 2012).
- a. Develop a
scatter diagram with DJIA as the independent variable. - b. Develop the estimated regression equation.
- c. Test for a significant relationship. Use α = .05.
- d. Did the estimated regression equation provide a good fit? Explain.
- e. Suppose that the closing price for the DJIA is 13,500. Predict the closing price for the S&P 500.
- f. Should we be concerned that the DJIA value of 13,500 used to predict the S&P 500 value in part (e) is beyond the
range of the data used to develop the estimated regression equation?
a.
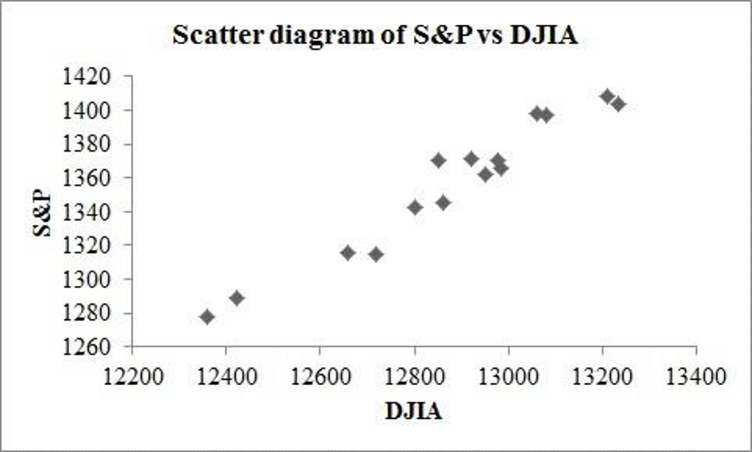
Draw a scatter diagram with DIJA as the independent variable.
Answer to Problem 55SE
The scatter diagram is obtained as follows:
Explanation of Solution
Calculation:
The data shows the closing price for the DIJA and S&P 500 for 15 weeks, beginning with Jan 6, 2012.
Software procedure:
Step-by-step software procedure to draw the scatter diagram using EXCEL:
- Open an EXCEL file.
- In column A enter the data of DJIA and in column B enter the corresponding values of S&P.
- Select the data that is to be displayed.
- Click on the Insert Tab > select Scatter icon.
- Choose a Scatter with only Markers.
- Click on the chart > select Layout from the Chart Tools.
- Select Axis Title > Primary Horizontal Axis Title > Title Below Axis.
- Enter DJIA in the dialog box
- Select Axis Title > Primary Vertical Axis Title > Rotated Title.
- Enter S&P in the dialog box.
b.
Find the estimated regression equation.
Answer to Problem 55SE
The estimated regression equation is
Explanation of Solution
Calculation:
The estimated regression equation is to be obtained.
Software procedure:
Step-by-step procedure to obtain the estimated regression equation using Excel:
- In Excel sheet, enter S&P and DJIA in different columns.
- In Data, select Data Analysis and choose Regression.
- In Input Y Range, select S&P.
- In Input X Range, select DJIA.
- Select Labels.
- Click OK.
Output obtained using Excel is given below:
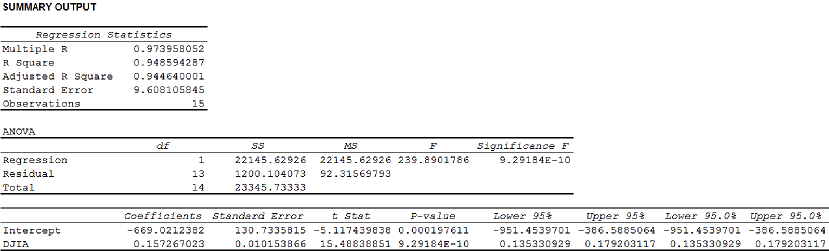
Thus, the estimated regression equation is
c.
Test for a significant relationship at
Answer to Problem 55SE
There is a significant relationship between S&P and DJIA.
Explanation of Solution
Calculation:
Consider that
State the test hypotheses.
Null hypothesis:
That is, there is no significant relationship between S&P and DJIA.
Alternative hypothesis:
That is, there is a significant relationship between S&P and DJIA.
From the output in pat (b) it is found that the F-test statistic is 239.89.
Level of significance:
The given level of significance is
p-value:
From the output in Pat (b), it is found that the p-value is 0.
Rejection rule:
If
Conclusion:
Here, the p-value is less than the level of significance.
That is,
Thus, the decision is “reject the null hypothesis”.
Therefore, the data provides sufficient evidence to conclude that there is a significant relationship between S&P and DJIA.
Thus, S&P and DJIA are related.
d.
Explain whether the estimated regression provides a good fit.
Answer to Problem 55SE
The model provides a good fit.
Explanation of Solution
Calculation:
The coefficient of determination (
In the given output in Part (b),
Thus, the percentage of variation in the observed values of S&P 500 is explained by the regression is 94.86%, which indicates that 94.86% of the variability in S&P 500 is explained by the variability in DJIP using linear regression model.
Thus, the model provides a good fit.
e.
Predict the closing price for the S&P 500.
Answer to Problem 55SE
The predicted closing price for the S&P 500 is 1,454.
Explanation of Solution
Calculation:
The closing price for the DJIA is 13,500.
Using the estimated regression equation
Thus, the predicted closing price for the S&P 500 is 1,454.
f.
Explain whether it is concerned that the DJIA is 13,500 used to predict the S&P 500 value in Part (e) is beyond the range of the data used to develop the estimated regression equation.
Explanation of Solution
From Part (e), it is found that the predicted closing price for the S&P 500 is 1,454.
According to the scatter diagram or given data, it can be said that the predicted DJIA is not far beyond the range of the data. Thus, there should not be too concern about using the estimated regression equation to predict S&P 500.
Want to see more full solutions like this?
Chapter 14 Solutions
Modern Business Statistics with Microsoft Excel (MindTap Course List)


- Cholesterol Cholesterol in human blood is necessary, but too much can lead to health problems. There are three main types of cholesterol: HDL (high-density lipoproteins), LDL (low-density lipoproteins), and VLDL (very low-density lipoproteins). HDL is considered “good” cholesterol; LDL and VLDL are considered “bad” cholesterol. A standard fasting cholesterol blood test measures total cholesterol, HDL cholesterol, and triglycerides. These numbers are used to estimate LDL and VLDL, which are difficult to measure directly. Your doctor recommends that your combined LDL/VLDL cholesterol level be less than 130 milligrams per deciliter, your HDL cholesterol level be at least 60 milligrams per deciliter, and your total cholesterol level be no more than 200 milligrams per deciliter. (a) Write a system of linear inequalities for the recommended cholesterol levels. Let x represent the HDL cholesterol level, and let y represent the combined LDL VLDL cholesterol level. (b) Graph the system of inequalities from part (a). Label any vertices of the solution region. (c) Is the following set of cholesterol levels within the recommendations? Explain. LDL/VLDL: 120 milligrams per deciliter HDL: 90 milligrams per deciliter Total: 210 milligrams per deciliter (d) Give an example of cholesterol levels in which the LDL/VLDL cholesterol level is too high but the HDL cholesterol level is acceptable. (e) Another recommendation is that the ratio of total cholesterol to HDL cholesterol be less than 4 (that is, less than 4 to 1). Identify a point in the solution region from part (b) that meets this recommendation, and explain why it meets the recommendation.arrow_forwardConsider a business owner, how would you use methodology and the data results to increase sales or improve overall profitability? What are some of your recommendations?arrow_forwardHow will marketers change their social media use in the near future? A survey by Social Media Examiner reported that 77% of B2B marketers (marketers that focus primarily on attracting businesses) plan to increase their use of LinkedIn, as compared to 54% of B2C marketers (marketers that primarily target consumers). The survey was based on 1,184 B2B marketers and 1,703 B2C marketers. The following table summarizes the results: Give an example of a simple Give an example of a joint What is the complement of a marketer who plans to increase use of LinkedIn? Why is a marketer who plans to increase use of LinkedIn and is a B2C marketer a joint event?arrow_forward
- Does the proportion of Democrats who support Medicare for all appear to be substantially different than the 70% rate foir the general population? If so, why do you think that is?arrow_forwardWhat is the stock market? How do you explain its significance to an economy?. The focus of your researched response should be within the Barbados context.arrow_forward

 Glencoe Algebra 1, Student Edition, 9780079039897...AlgebraISBN:9780079039897Author:CarterPublisher:McGraw Hill
 Holt Mcdougal Larson Pre-algebra: Student Edition...AlgebraISBN:9780547587776Author:HOLT MCDOUGALPublisher:HOLT MCDOUGAL