
Modern Business Statistics with Microsoft Excel (MindTap Course List)
5th Edition
ISBN: 9781285433301
Author: David R. Anderson, Dennis J. Sweeney, Thomas A. Williams
Publisher: Cengage Learning
expand_more
expand_more
format_list_bulleted
Videos
Textbook Question
Chapter 14.5, Problem 24E
The data from exercise 2 follow.
- a. Compute the mean square error using equation (14.15).
- b. Compute the standard error of the estimate using equation (14.16).
- c. Compute the estimated standard deviation of b1 using equation (14.18).
- d. Use the t test to test the following hypotheses (α = .05):
- e. Use the F test to test the hypotheses in part (d) at a .05 level of significance. Present the results in the analysis of variance table format.
Expert Solution & Answer
Want to see the full answer?
Check out a sample textbook solution
Students have asked these similar questions
From the data below;
x1
1
2
3
4
5
y1
3
7
5
11
14
a) Compute the mean square error
b) Compute the standard error of the estimate
c) Compute the estimated standard deviation of b1
d) Use the t-test to test the following hypothesis (α= .05)
Ho: β1 = 0
Ha: β1 ≠ 0
e) Use the F-test to test the hypotheses in part (d) at a 0.5 level of significance. Present in the analysis of variance format.
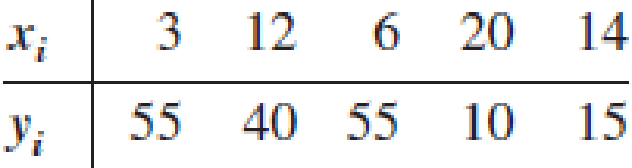
Consider the data.
xi
3
12
6
20
14
yi
60
40
65
5
15
(a)
Compute the mean square error using equation
s2 = MSE =
SSE
n − 2
.
(Round your answer to two decimal places.)
(b)
Compute the standard error of the estimate using equation
s =
MSE
=
SSE
n − 2
.
(Round your answer to three decimal places.)
(c)
Compute the estimated standard deviation of
b1
using equation
sb1 =
s
Σ(xi − x)2
.
(Round your answer to three decimal places.)
(d)
Use the t test to test the following hypotheses (? = 0.05):
H0:
β1
=
0
Ha:
β1
≠
0
Find the value of the test statistic. (Round your answer to three decimal places.)
Find the p-value. (Round your answer to four decimal places.)
p-value =
Use the F test to test the hypotheses in part (d) at a 0.05 level of significance. Present the results in the analysis of variance table format.
Set up the ANOVA table. (Round your values for MSE and F to two…
Consider the data.
xi
1
2
3
4
5
yi
3
7
5
11
14
(a)
Compute the mean square error using equation
s2 = MSE =
SSE
n − 2
.
(Round your answer to two decimal places.)
(b)
Compute the standard error of the estimate using equation
s =
MSE
=
SSE
n − 2
.
(Round your answer to three decimal places.)
(c) Compute the estimated standard deviation of
b1
using equation
sb1 =
s
Σ(xi − x)2
.
(Round your answer to three decimal places.)
(d)
Use the t test to test the following hypotheses (? = 0.05):
H0:
β1
=
0
Ha:
β1
≠
0
Find the value of the test statistic. (Round your answer to three decimal places.) =____
Find the p-value. (Round your answer to four decimal places.)
p-value = _____
State your conclusion.
(A) Reject H0. We cannot conclude that the relationship between x and y is significant.(B) Do not reject H0. We cannot conclude that the relationship between x and y is…
Chapter 14 Solutions
Modern Business Statistics with Microsoft Excel (MindTap Course List)
Ch. 14.2 - Given are five observations for two variables, x...Ch. 14.2 - Given are five observations for two variables, x...Ch. 14.2 - Given are five observations collected in a...Ch. 14.2 - Retail and Trade: Female Managers. The following...Ch. 14.2 - Production Line Speed and Quality Control. Brawdy...Ch. 14.2 - The National Football League (NFL) records a...Ch. 14.2 - Sales Experience and Performance. A sales manager...Ch. 14.2 - Broker Satisfaction. The American Association of...Ch. 14.2 - Companies in the U.S. car rental market vary...Ch. 14.2 - Prob. 10E
Ch. 14.2 - Laptop Ratings. To help consumers in purchasing a...Ch. 14.2 - Prob. 12ECh. 14.2 - Distance and Absenteeism. A large city hospital...Ch. 14.2 - Using a global-positioning-system (GPS)-based...Ch. 14.3 - 15. The data from exercise 1...Ch. 14.3 - The data from exercise 2 follow.
The estimated...Ch. 14.3 - Prob. 17ECh. 14.3 - Price and Quality of Headphones. The following...Ch. 14.3 - Sales Experience and Sales Performance. In...Ch. 14.3 - Price and Weight of Bicycles. Bicycling, the...Ch. 14.3 - Cost Estimation. An important application of...Ch. 14.3 - 22. Refer to exercise 9, where the following data...Ch. 14.5 - The data from exercise 1 follow.
Compute the mean...Ch. 14.5 - The data from exercise 2 follow.
Compute the mean...Ch. 14.5 - The data from exercise 3 follow.
What is the...Ch. 14.5 - Prob. 26ECh. 14.5 - Prob. 27ECh. 14.5 - Broker Satisfaction Conclusion. In exercise 8,...Ch. 14.5 - Cost Estimation Conclusion. Refer to exercise 21,...Ch. 14.5 - Significance of Fleet Size on Rental Car Revenue....Ch. 14.5 - Significance of Racing Bike Weight on Price. In...Ch. 14.6 - 32. The data from exercise 1...Ch. 14.6 - 33. The data from exercise 2...Ch. 14.6 - Prob. 34ECh. 14.6 - 35. The following data are the monthly salaries y...Ch. 14.6 - 36. In exercise 7, the data on y = annual sales ($...Ch. 14.6 - In exercise 5, the following data on x = the...Ch. 14.6 - Prob. 38ECh. 14.6 - 39. In exercise 12, the following data on x =...Ch. 14.7 - The commercial division of a real estate firm...Ch. 14.7 - Following is a portion of the regression output...Ch. 14.7 - Out-of-state tuition and fees at the top graduate...Ch. 14.7 - Auto Racing Helmet. Automobile racing,...Ch. 14.8 - Prob. 45ECh. 14.8 - Prob. 46ECh. 14.8 - Prob. 47ECh. 14.8 - Prob. 48ECh. 14.8 - Prob. 49ECh. 14.9 - Consider the following data for two variables, x...Ch. 14.9 - Prob. 51ECh. 14.9 - Predicting Charity Expenses. Charity Navigator is...Ch. 14.9 - Many countries, especially those in Europe, have...Ch. 14.9 - Prob. 54ECh. 14 - The Dow Jones Industrial Average (DJIA) and the...Ch. 14 - Prob. 56SECh. 14 - Prob. 57SECh. 14 - Machine Maintenance. Jensen Tire & Auto is in the...Ch. 14 - Bus Maintenance. The regional transit authority...Ch. 14 - Reuters reported the market beta for Xerox was...Ch. 14 - Used Car Mileage and Price. The Toyota Camry is...Ch. 14 - Prob. 62SECh. 14 - One measure of the risk or volatility of an...Ch. 14 - As part of a study on transportation safety, the...Ch. 14 - Consumer Reports tested 166 different...Ch. 14 - When trying to decide what car to buy, real value...
Knowledge Booster


Learn more about
Need a deep-dive on the concept behind this application? Look no further. Learn more about this topic, statistics and related others by exploring similar questions and additional content below.Similar questions
- Consider the data. xi 1 2 3 4 5 yi 3 8 5 10 14 (a) Compute the mean square error using equation s2 = MSE= SSE n − 2 . (Round your answer to two decimal places.) (b) Compute the standard error of the estimate using equation s = MSE = SSE n − 2 . (Round your answer to three decimal places.) (c) Compute the estimated standard deviation of b1 using equation sb1 = s Σ(xi − x)2 . (Round your answer to three decimal places.) (d) Use the t test to test the following hypotheses (? = 0.05): H0: ?1 = 0 Ha: ?1 ≠ 0 Find the value of the test statistic. (Round your answer to three decimal places.) Find the p-value. (Round your answer to four decimal places.) p-value = State your conclusion. Do not reject H0. We cannot conclude that the relationship between x and y is significant. Reject H0. We cannot conclude that the relationship between x and y is significant. Do not reject H0.…arrow_forwardGiven are five observations for two variables, x and y. xi 2 7 15 18 20 yi 60 51 42 12 14 Use the estimated regression equation: y^=68.5866-2.6441 . a. Compute the mean square error using equation. (to 4 decimals) b. Compute the standard error of the estimate using equation. (to 4 decimals) c. Compute the estimated standard deviation of b1 using equation. (to 4 decimals) d. Use the t-test to test the following hypotheses (a=0.05): Compute the value of the t-test statistic (Enter negative values as negative numbers). (to 3 decimals) What is the p-value? Use Table 2 from Appendix B. p-value is What is your conclusion? We (do not reject, reject). e. Use the F-test to test the hypotheses in part (d) at a 0.05 level of significance. Complete the F table below using Excel. Calculate the Sum of Squares (to 1 decimal), the Mean Squares (to 1 decimal), and the F ratio (to 2 decimals) and the p-value (to 4 decimals). Sourceof Variation Degreesof Freedom Sum ofSquares MeanSquare F…arrow_forwardA snack food manufacturer estimates that the variance of the number of grams of carbohydrates in servings of its tortilla chips is 1.34. A dietician is asked to test this claim and finds that a random sample of 16 servings has a variance of 1.22. At α=0.05, is there enough evidence to reject the manufacturer's claim? Assume the population is normally distributed. Complete parts (a) through (e) below.arrow_forward
- The following is part of the computer output from a regression of monthly returns on Waterworks stock against the S&P 500 Index. A hedge fund manager believes that Waterworks is underpriced, with an alpha of 2% over the coming month. Beta R-square Standard Deviationof Residuals 0.75 0.65 0.06 (i.e., 6% monthly) Now suppose that the manager misestimates the beta of Waterworks stock, believing it to be 0.50 instead of 0.75. The standard deviation of the monthly market rate of return is 5%. Required: a. If he holds a $6 million portfolio of Waterworks stock and wishes to hedge market exposure for the next month using one-month maturity S&P 500 futures contracts, what is the standard deviation of the (now improperly) hedged portfolio? The S&P 500 currently is at 3,000 and the contract multiplier is $50. (Do not round intermediate calculations. Round your percentage answer to 2 decimal places.) b. What is the probability of incurring a loss over the next month…arrow_forwardA sample of n = 25 subjects has a mean of M = 38.99 and a sample standard deviation of sx = 4.3. In a directional test of H0: μ≤37.27 versus H1: μ>37.27 with α=0.05, this sample produces a tstatistic of t=+2.00. Based on this information, the correct statistical decision is to:arrow_forwardCONSIDER that the data is CORRELATED use alpha .05. Provide the following: 1. CI of the F value 2. Statistical Interpretationarrow_forward
- If you were constructing a 99% confidence interval of the population mean based on a sample ofn = 41 where the standard deviation of the sample is S = 15, the critical value of t will bearrow_forwardThe Toylot company makes an electric train with a motor that it claims will draw an average of only 0.8 ampere (A) under a normal load. A sample of nine motors was tested, and it was found that the mean current was x = 1.34 A, with a sample standard deviation of s = 0.41 A. Do the data indicate that the Toylot claim of 0.8 A is too low? (Use a 1% level of significance.) State the null and alternate hypotheses. H0: μ ≠ 0.8; H1: μ = 0.8H0: μ = 0.8; H1: μ ≠ 0.8 H0: p = 0.8; H1: p ≠ 0.8H0: p ≠ 0.8; H1: p = 0.8H0: p = 0.8; H1: p > 0.8H0: μ = 0.8; H1: μ > 0.8 What sampling distribution will you use? What assumptions are you making? The Student's t, since we assume that x has a normal distribution with known σ.The standard normal, since we assume that x has a normal distribution with unknown σ. The standard normal, since we assume that x has a normal distribution with known σ.The Student's t, since we assume that x has a normal distribution with unknown σ. What is the value of the…arrow_forwardA fisheries biologist collected a random sample of fish from a lake and conducted a chi-square goodness-of-fit test to see if the distribution of fish changed over time. The table below shows the distribution of fish that were put into the lake when it was originally stocked. Fish Type Trout Bass Perch Sunfish Catfish Percent 25% 25% 20% 15% 15% The biologist found evidence to reject the null hypothesis in favor of the alternative hypothesis. Which of the following represents the alternative hypothesis of the test?arrow_forward
- A snack food manufacturer estimates that the variance of the number of grams of carbohydrates in servings of its tortilla chips is 1.33. A dietician is asked to test this claim and finds that a random sample of 24 servings has a variance of 1.37. At α=0.01, is there enough evidence to reject the manufacturer's claim? Assume the population is normally distributed. Complete parts (a) through (e) below. (a) Write the claim mathematically and identify H0 and Ha. A. H0: σ2≤1.33 (Claim) Ha: σ2>1.33 B. H0: σ2≠1.33 Ha: σ2=1.33 (Claim) C. H0: σ2≥1.33 Ha: σ2<1.33 (Claim) D. H0: σ2=1.33 (Claim) Ha: σ2≠1.33 (b) Find the critical value(s) and identify the rejection region(s). The critical value(s) is(are) enter your response here. (Round to two decimal places as needed. Use a comma to separate answers as needed.) Choose the correct statement below and fill in the corresponding answer boxes. A. The…arrow_forwardIf the test of H0: = 19 against Ha: ≠ 19 based on an SRS of 15 observations from a Normal populationproduces the statistic of t = –1.75. The P-value isarrow_forwardIn a comparison of two methods for the determination of chromium in rye grass, the following results were obtained: Method A, mean(mg/kg Cr)=1.48 Standard deviation(mg/kg Cr)=0.28 n= 6 Method B, mean (mg/kg Cr)=2.33 Standard deviation(mg/kg Cr)=0.31 n=10 Is the precision of these two methods significantly different? Do these two methods give results with means which differ significantly? a=0.05arrow_forward
arrow_back_ios
SEE MORE QUESTIONS
arrow_forward_ios
Recommended textbooks for you
 MATLAB: An Introduction with ApplicationsStatisticsISBN:9781119256830Author:Amos GilatPublisher:John Wiley & Sons Inc
 Probability and Statistics for Engineering and th...StatisticsISBN:9781305251809Author:Jay L. DevorePublisher:Cengage Learning
 Statistics for The Behavioral Sciences (MindTap C...StatisticsISBN:9781305504912Author:Frederick J Gravetter, Larry B. WallnauPublisher:Cengage Learning
 Elementary Statistics: Picturing the World (7th E...StatisticsISBN:9780134683416Author:Ron Larson, Betsy FarberPublisher:PEARSON
 The Basic Practice of StatisticsStatisticsISBN:9781319042578Author:David S. Moore, William I. Notz, Michael A. FlignerPublisher:W. H. Freeman
 Introduction to the Practice of StatisticsStatisticsISBN:9781319013387Author:David S. Moore, George P. McCabe, Bruce A. CraigPublisher:W. H. Freeman
MATLAB: An Introduction with Applications
Statistics
ISBN:9781119256830
Author:Amos Gilat
Publisher:John Wiley & Sons Inc
Probability and Statistics for Engineering and th...
Statistics
ISBN:9781305251809
Author:Jay L. Devore
Publisher:Cengage Learning
Statistics for The Behavioral Sciences (MindTap C...
Statistics
ISBN:9781305504912
Author:Frederick J Gravetter, Larry B. Wallnau
Publisher:Cengage Learning
Elementary Statistics: Picturing the World (7th E...
Statistics
ISBN:9780134683416
Author:Ron Larson, Betsy Farber
Publisher:PEARSON
The Basic Practice of Statistics
Statistics
ISBN:9781319042578
Author:David S. Moore, William I. Notz, Michael A. Fligner
Publisher:W. H. Freeman
Introduction to the Practice of Statistics
Statistics
ISBN:9781319013387
Author:David S. Moore, George P. McCabe, Bruce A. Craig
Publisher:W. H. Freeman
Hypothesis Testing using Confidence Interval Approach; Author: BUM2413 Applied Statistics UMP;https://www.youtube.com/watch?v=Hq1l3e9pLyY;License: Standard YouTube License, CC-BY
Hypothesis Testing - Difference of Two Means - Student's -Distribution & Normal Distribution; Author: The Organic Chemistry Tutor;https://www.youtube.com/watch?v=UcZwyzwWU7o;License: Standard Youtube License