Modern Business Statistics with Microsoft Excel (MindTap Course List)
5th Edition
ISBN: 9781285433301
Author: David R. Anderson, Dennis J. Sweeney, Thomas A. Williams
Publisher: Cengage Learning
bartleby

Concept explainers

bartleby

Videos

Textbook Question
Book Icon
Chapter 14, Problem 4CP

When trying to decide what car to buy, real value is not necessarily determined by how much you spend on the initial purchase. Instead, cars that are reliable and don’t cost much to own often represent the best values. But, no matter how reliable or inexpensive a car may cost to own, it must also perform well.

To measure value, Consumer Reports developed a statistic referred to as a value score. The value score is based upon five-year owner costs, overall road-test scores, and predicted reliability ratings. Five-year owner costs are based on the expenses incurred in the first five years of ownership, including depreciation, fuel, maintenance and repairs, and so on. Using a national average of 12,000 miles per year, an average cost per mile driven is used as the measure of five-year owner costs. Road-test scores are the results of more than 50 tests and evaluations and are based upon a 100-point scale, with higher scores indicating better performance, comfort, convenience, and fuel economy. The highest road-test score obtained in the tests conducted by Consumer Reports was a 99 for a Lexus LS 460L. Predicted-reliability ratings (1 = Poor, 2 = Fair, 3 = Good, 4 = Very Good, and 5 = Excellent) are based on data from Consumer Reports’ Annual Auto Survey.

A car with a value score of 1.0 is considered to be “average-value.” A car with a value score of 2.0 is considered to be twice as good a value as a car with a value score of 1.0; a car with a value score of .5 is considered half as good as average; and so on. The data for 20 family sedans, including the price ($) of each car tested, follow.

Chapter 14, Problem 4CP, When trying to decide what car to buy, real value is not necessarily determined by how much you

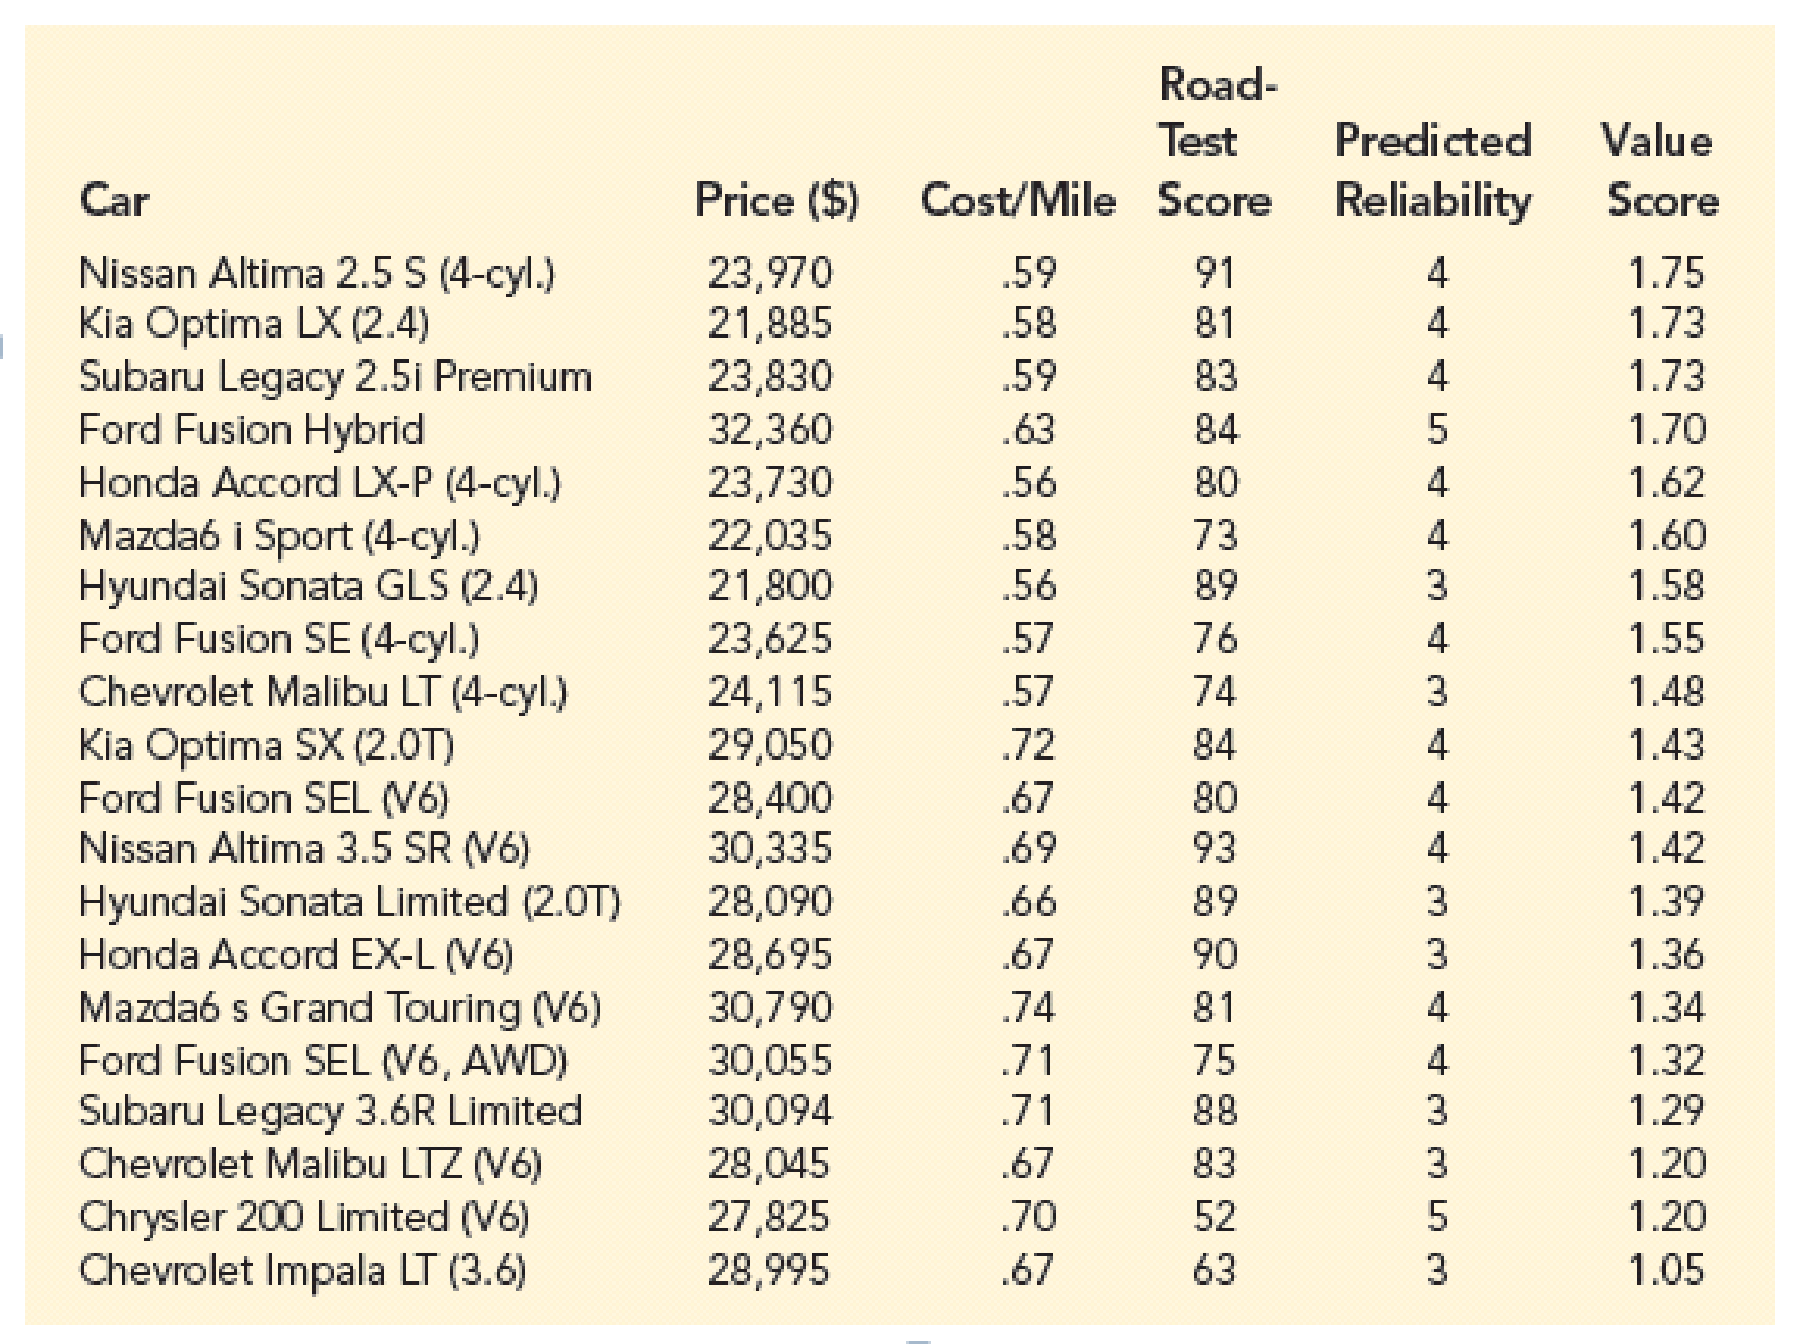
  1. 1. Develop numerical summaries of the data.
  2. 2. Use regression analysis to develop an estimated regression equation that could be used to predict the value score given the price of the car.
  3. 3. Use regression analysis to develop an estimated regression equation that could be used to predict the value score given the five-year owner costs (cost/mile).
  4. 4. Use regression analysis to develop an estimated regression equation that could be used to predict the value score given the road-test score.
  5. 5. Use regression analysis to develop an estimated regression equation that could be used to predict the value score given the predicted-reliability.
  6. 6. What conclusions can you derive from your analysis?
Blurred answer

Chapter 14 Solutions

Modern Business Statistics with Microsoft Excel (MindTap Course List)

Ch. 14.2 - Laptop Ratings. To help consumers in purchasing a...Ch. 14.2 - Prob. 12ECh. 14.2 - Distance and Absenteeism. A large city hospital...Ch. 14.2 - Using a global-positioning-system (GPS)-based...Ch. 14.3 - 15. The data from exercise 1...Ch. 14.3 - The data from exercise 2 follow. The estimated...Ch. 14.3 - Prob. 17ECh. 14.3 - Price and Quality of Headphones. The following...Ch. 14.3 - Sales Experience and Sales Performance. In...Ch. 14.3 - Price and Weight of Bicycles. Bicycling, the...Ch. 14.3 - Cost Estimation. An important application of...Ch. 14.3 - 22. Refer to exercise 9, where the following data...Ch. 14.5 - The data from exercise 1 follow. Compute the mean...Ch. 14.5 - The data from exercise 2 follow. Compute the mean...Ch. 14.5 - The data from exercise 3 follow. What is the...Ch. 14.5 - Prob. 26ECh. 14.5 - Prob. 27ECh. 14.5 - Broker Satisfaction Conclusion. In exercise 8,...Ch. 14.5 - Cost Estimation Conclusion. Refer to exercise 21,...Ch. 14.5 - Significance of Fleet Size on Rental Car Revenue....Ch. 14.5 - Significance of Racing Bike Weight on Price. In...Ch. 14.6 - 32. The data from exercise 1...Ch. 14.6 - 33. The data from exercise 2...Ch. 14.6 - Prob. 34ECh. 14.6 - 35. The following data are the monthly salaries y...Ch. 14.6 - 36. In exercise 7, the data on y = annual sales ($...Ch. 14.6 - In exercise 5, the following data on x = the...Ch. 14.6 - Prob. 38ECh. 14.6 - 39. In exercise 12, the following data on x =...Ch. 14.7 - The commercial division of a real estate firm...Ch. 14.7 - Following is a portion of the regression output...Ch. 14.7 - Out-of-state tuition and fees at the top graduate...Ch. 14.7 - Auto Racing Helmet. Automobile racing,...Ch. 14.8 - Prob. 45ECh. 14.8 - Prob. 46ECh. 14.8 - Prob. 47ECh. 14.8 - Prob. 48ECh. 14.8 - Prob. 49ECh. 14.9 - Consider the following data for two variables, x...Ch. 14.9 - Prob. 51ECh. 14.9 - Predicting Charity Expenses. Charity Navigator is...Ch. 14.9 - Many countries, especially those in Europe, have...Ch. 14.9 - Prob. 54ECh. 14 - The Dow Jones Industrial Average (DJIA) and the...Ch. 14 - Prob. 56SECh. 14 - Prob. 57SECh. 14 - Machine Maintenance. Jensen Tire & Auto is in the...Ch. 14 - Bus Maintenance. The regional transit authority...Ch. 14 - Reuters reported the market beta for Xerox was...Ch. 14 - Used Car Mileage and Price. The Toyota Camry is...Ch. 14 - Prob. 62SECh. 14 - One measure of the risk or volatility of an...Ch. 14 - As part of a study on transportation safety, the...Ch. 14 - Consumer Reports tested 166 different...Ch. 14 - When trying to decide what car to buy, real value...
Knowledge Booster
Background pattern image
Statistics
Learn more about
Need a deep-dive on the concept behind this application? Look no further. Learn more about this topic, statistics and related others by exploring similar questions and additional content below.
Recommended textbooks for you
Text book image
Glencoe Algebra 1, Student Edition, 9780079039897...
Algebra
ISBN:9780079039897
Author:Carter
Publisher:McGraw Hill
Text book image
Holt Mcdougal Larson Pre-algebra: Student Edition...
Algebra
ISBN:9780547587776
Author:HOLT MCDOUGAL
Publisher:HOLT MCDOUGAL
Text book image
Big Ideas Math A Bridge To Success Algebra 1: Stu...
Algebra
ISBN:9781680331141
Author:HOUGHTON MIFFLIN HARCOURT
Publisher:Houghton Mifflin Harcourt
Correlation Vs Regression: Difference Between them with definition & Comparison Chart; Author: Key Differences;https://www.youtube.com/watch?v=Ou2QGSJVd0U;License: Standard YouTube License, CC-BY
Correlation and Regression: Concepts with Illustrative examples; Author: LEARN & APPLY : Lean and Six Sigma;https://www.youtube.com/watch?v=xTpHD5WLuoA;License: Standard YouTube License, CC-BY