
Concept explainers
Videos
Reuters reported the market beta for Xerox was 1.22 (Reuters website, January 30, 2009). Market betas for individual stocks are determined by simple linear regression. For each stock, the dependent variable is its quarterly percentage return (capital appreciation plus dividends) minus the percentage return that could be obtained from a risk-free investment (the Treasury Bill rate is used as the risk-free rate). The independent variable is the quarterly percentage return (capital appreciation plus dividends) for the stock market (S&P 500) minus the percentage return from a risk-free investment. An estimated regression equation is developed with quarterly data; the market beta for the stock is the slope of the estimated regression equation (b1). The value of the market beta is often interpreted as a measure of the risk associated with the stock. Market betas greater than 1 indicate that the stock is more volatile than the market average; market betas less than 1 indicate that the stock is less volatile than the market average. Suppose that the following figures are the differences between the percentage return and the risk-free return for 10 quarters for the S&P 500 and Horizon Technology.
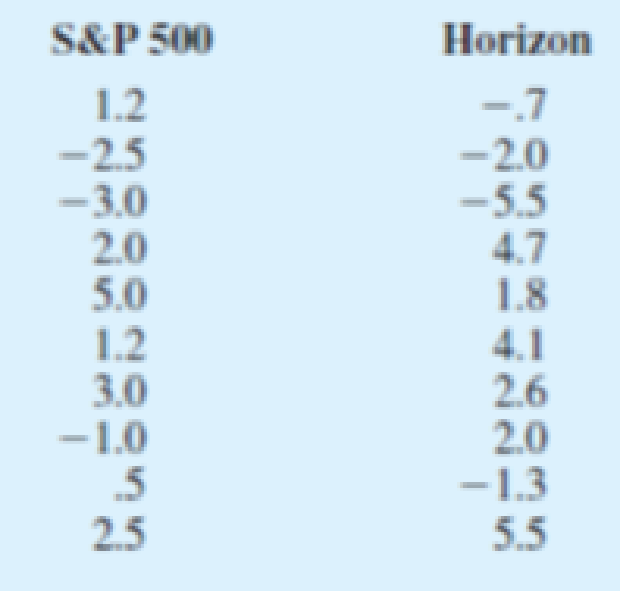
- a. Develop an estimated regression equation that can be used to predict the market beta for Horizon Technology. What is Horizon Technology’s market beta?
- b. Test for a significant relationship at the .05 level of significance.
- c. Did the estimated regression equation provide a good fit? Explain.
- d. Use the market betas of Xerox and Horizon Technology to compare the risk associated with the two stocks.
Want to see the full answer?
Check out a sample textbook solution
Chapter 14 Solutions
Modern Business Statistics with Microsoft Excel (MindTap Course List)


- If your graphing calculator is capable of computing a least-squares sinusoidal regression model, use it to find a second model for the data. Graph this new equation along with your first model. How do they compare?arrow_forwardWhich pair of h0/h1 is used in the two sided test for the slope of a simple linear regression?arrow_forwardThe new manager of an Information Technology company collected data for a sample of 20 computer programmers in the organization to perform a multiple regression analysis on the structure of their salaries. The aim of this manager in this exercise is to determine if the Salary (y) of a hired computer programmer was related to the years of Experience (??) in the organization and also the Score (??) of the programmers during their first interview aptitude test scores. The years of experience, score on the aptitude test and the corresponding annual salary (in thousands of Ghana cedis) for a sample of the 20 programmers is shown in the Regression statistics table below; Experience (??) (in years) Score (??) (out of 100%) Salary (y) (GH¢ 000) 4 78 24 7 100 43 1 86 23.7 5 82 34.3 8 86 35.8 10 84 38 0 75 22.2 1 80 23.1 6 83 30 6 91 33 9 88 38 2 73 26.6 10 75 36.2 5 81 31.6…arrow_forward
- State whether the slope of a simple linear regression line is statistically significant, then the correlation will also always be significant?arrow_forwardThe new manager of an Information Technology company collected data for a sample of 20 computer programmers in the organization to perform a multiple regression analysis on the structure of their salaries. The aim of this manager in this exercise is to determine if the Salary (y) of a hired computer programmer was related to the years of Experience (??) in the organization and also the Score (??) of the programmers during their first interview aptitude test scores. The years of experience, score on the aptitude test and the corresponding annual salary (in thousands of Ghana cedis) for a sample of the 20 programmers is shown in the Regression statistics table below; Experience (??) (in years) Score (??) (out of 100%) Salary (y) (GH¢ 000) 4 78 24 7 100 43 1 86 23.7 5 82 34.3 8 86 35.8 10 84 38 0 75 22.2 1 80 23.1 6 83 30 6 91 33 9 88 38 2 73 26.6 10 75 36.2 5 81 31.6…arrow_forward
 Algebra and Trigonometry (MindTap Course List)AlgebraISBN:9781305071742Author:James Stewart, Lothar Redlin, Saleem WatsonPublisher:Cengage Learning
 Linear Algebra: A Modern IntroductionAlgebraISBN:9781285463247Author:David PoolePublisher:Cengage Learning
 Algebra & Trigonometry with Analytic GeometryAlgebraISBN:9781133382119Author:SwokowskiPublisher:Cengage
 Glencoe Algebra 1, Student Edition, 9780079039897...AlgebraISBN:9780079039897Author:CarterPublisher:McGraw Hill
 Trigonometry (MindTap Course List)TrigonometryISBN:9781305652224Author:Charles P. McKeague, Mark D. TurnerPublisher:Cengage Learning
 Big Ideas Math A Bridge To Success Algebra 1: Stu...AlgebraISBN:9781680331141Author:HOUGHTON MIFFLIN HARCOURTPublisher:Houghton Mifflin Harcourt