
Probability and Statistics for Engineering and the Sciences
9th Edition
ISBN: 9781305251809
Author: Jay L. Devore
Publisher: Cengage Learning
expand_more
expand_more
format_list_bulleted
Videos
Textbook Question
Chapter 1.4, Problem 56E
The following data on distilled alcohol content (%) for a sample of 35 port wines was extracted from the article “A Method for the Estimation of Alcohol in Fortified Wines Using Hydrometer Baume and Refractometer Brix” (Amer. J. Enol. Vitic., 2006: 486-490). Each value is an average of two duplicate measurements.
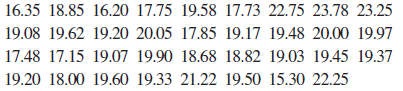
Use methods from this chapter, including a boxplot that shows outliers, to describe and summarize the data.
Expert Solution & Answer

Trending nowThis is a popular solution!

Students have asked these similar questions
The spike stature of the plants grown from the seeds of the porcine separates (Dactylis glomerata L) collected from the University campus and İbradı Eynif pasture are given below. In this plant, compare whether there is a difference between regions in terms of spike height.
Virgo Height (cm)
Data obtained from plants collected from university campus
5 6 8 7 8 6 5 5 4 6 6
Data obtained from plants collected from Eynif pasture
12 9 11 9 9 11 9 10 11 10
Note: Your results
interpretation according to two different possibilities
(Do it separately, assuming that it is 0.07 and 0.04).
An article contained the following observations on degree of polymerization for paper specimens for which viscosity times concentration fell in a certain middle range:
416
421
422
423
426
428
430
434
437
439
446
447
449
453
456
462
464
Comment on any interesting features. (Select all that apply.)
___The data appears to be centered near 438.
___There are no outliers.
___There is little or no skew.
___There is one outlier.
___The data is strongly skewed.
___The data appears to be centered near 428
Calculate a two-sided 95% confidence interval for true average degree of polymerization. (Round your answers to two decimal places.)
(____, ____)
An article contained the following observations on degree of polymerization for paper specimens for which viscosity times concentration fell in a certain middle range:
416
421
422
423
426
428
430
434
437
439
446
447
449
453
456
462
464
Comment on any interesting features. (Select all that apply.)
__The data appears to be centered near 438.
__There are no outliers.
__There is little or no skew.
__There is one outlier.
__The data is strongly skewed.
__The data appears to be centered near 428.
(c) Calculate a two-sided 95% confidence interval for true average degree of polymerization. (Round your answers to two decimal places.)
(______,_______)
Chapter 1 Solutions
Probability and Statistics for Engineering and the Sciences
Ch. 1.1 - Give one possible sample of size 4 from each of...Ch. 1.1 - For each of the following hypothetical...Ch. 1.1 - Consider the population consisting of all...Ch. 1.1 - a. Give three different examples of concrete...Ch. 1.1 - Many universities and colleges have instituted...Ch. 1.1 - The California State University (CSU) system...Ch. 1.1 - A certain city divides naturally into ten district...Ch. 1.1 - The amount of flow through a solenoid valve in an...Ch. 1.1 - In a famous experiment carried out in 1882,...Ch. 1.2 - Consider the strength data for beams given in...
Ch. 1.2 - The accompanying specific gravity values for...Ch. 1.2 - The accompanying summary data on CeO2 particle...Ch. 1.2 - Allowable mechanical properties for structural...Ch. 1.2 - The accompanying data set consists of observations...Ch. 1.2 - Do running limes of American movies differ somehow...Ch. 1.2 - The article cited in Example 1.2 also gave the...Ch. 1.2 - The accompanying data came from a study of...Ch. 1.2 - Every corporation has a governing board of...Ch. 1.2 - The number of contaminating particles on a silicon...Ch. 1.2 - The article Determination of Most Representative...Ch. 1.2 - The article cited in Exercise 20 also gave the...Ch. 1.2 - How does the speed of a runner vary over the...Ch. 1.2 - The article Statistical Modeling of the Time...Ch. 1.2 - The accompanying data set consists of observations...Ch. 1.2 - A transformation of data values by means of some...Ch. 1.2 - The accompanying summary data on CeO2 particle...Ch. 1.2 - The article Study on the Life Distribution of...Ch. 1.2 - The accompanying frequency distribution on...Ch. 1.2 - The following categories for type of physical...Ch. 1.2 - A Pareto diagram is a variation of a histogram for...Ch. 1.2 - The cumulative frequency and cumulative relative...Ch. 1.2 - Fire load (MJ/m2) is the heat energy that could be...Ch. 1.3 - The May 1, 2009, issue of The Montclarian reported...Ch. 1.3 - Exposure to microbial products, especially...Ch. 1.3 - Mercury is a persistent and dispersive...Ch. 1.3 - A sample of 26 offshore oil workers took part in a...Ch. 1.3 - The article Snow Cover and Temperature...Ch. 1.3 - Blood pressure values are often reported to the...Ch. 1.3 - The propagation of fatigue cracks in various...Ch. 1.3 - Compute the sample median. 25% trimmed mean. 10%...Ch. 1.3 - A sample of n = 10 automobiles was selected, and...Ch. 1.3 - a. If a constant c is added to each xi in a...Ch. 1.3 - An experiment to study the lifetime (in hours) for...Ch. 1.4 - Poly(3-hydroxybutyrate) (PHB), a semicrystalline...Ch. 1.4 - The value of Youngs modulus (GPa) was determined...Ch. 1.4 - The article Effects of Short-Term Warming on Low...Ch. 1.4 - Zinfandel is a popular red wine varietal produced...Ch. 1.4 - Exercise 34 presented the following data on...Ch. 1.4 - A study of the relationship between age and...Ch. 1.4 - In 1997 a woman sued a computer keyboard...Ch. 1.4 - The article A Thin-Film Oxygen Uptake Test for the...Ch. 1.4 - The first four deviations from the mean in a...Ch. 1.4 - A mutual fund is a professionally managed...Ch. 1.4 - Grip is applied to produce normal surface forces...Ch. 1.4 - Here is a stem-and-leaf display of the escape time...Ch. 1.4 - The following data on distilled alcohol content...Ch. 1.4 - A sample of 20 glass bottles of a particular type...Ch. 1.4 - A company utilizes two different machines to...Ch. 1.4 - Blood cocaine concentration (mg/L) was determined...Ch. 1.4 - Observations on burst strength (lb/in2) were...Ch. 1.4 - The accompanying comparative boxplot of gasoline...Ch. 1 - Consider the following information on ultimate...Ch. 1 - A sample of 77 individuals working at a particular...Ch. 1 - Fretting is a wear process that results from...Ch. 1 - The accompanying frequency distribution of...Ch. 1 - A deficiency of the (race element selenium in the...Ch. 1 - Aortic stenosis refers to a narrowing of the...Ch. 1 - a. For what value of c is the quantity (xi c)2...Ch. 1 - a. Let a and b be constants and let yi = axi + b...Ch. 1 - Elevated energy consumption during exercise...Ch. 1 - Here is a description from Minitab of the strength...Ch. 1 - Anxiety disorders and symptoms can often be...Ch. 1 - The article Can We Really Walk Straight? (Amer. J....Ch. 1 - The mode of a numerical data set is the value that...Ch. 1 - Specimens of three different types of rope wire...Ch. 1 - The three measures of center introduced in this...Ch. 1 - The authors of the article Predictive Model for...Ch. 1 - Consider a sample x1 , x2,..., xn and suppose that...Ch. 1 - Let xn and sn2 denote the sample mean and variance...Ch. 1 - Lengths of bus routes for any particular transit...Ch. 1 - A study carried out to investigate the...Ch. 1 - Prob. 82SECh. 1 - Prob. 83SECh. 1 - Consider a sample x1, ... , xn with n even. Let xL...
Knowledge Booster


Learn more about
Need a deep-dive on the concept behind this application? Look no further. Learn more about this topic, statistics and related others by exploring similar questions and additional content below.Similar questions
- Wild irises are beautiful flowers found throughout the United States, Canada, and northern Europe. This problem concerns the length of the sepal (leaf-like part covering the flower) of different species of wild iris. Data are based on information taken from an article by R. A. Fisher in Annals of Eugenics (Vol. 7, part 2, pp. 179 -188). Measurements of sepal length in centimeters from random samples of Iris setosa (I), Iris versicolor (II), and Iris virginica (III) are as follows below. I II III 5.5 5.2 6.7 4.4 6.5 5.7 5.2 6.9 4.1 5.9 4.4 7.8 4.3 5.5 5.7 5.3 6.4 6.1 5.8 5.5 6.9 Shall we reject or not reject the claim that there are no differences among the population means of sepal length for the different species of iris? Use a 10% level of significance. (a) What is the level of significance? (b) Find SSTOT, SSBET, and SSW and check that SSTOT = SSBET + SSW. (Use 3 decimal places.) SSTOT = ? SSBET = ? SSW = ? Find d.f.BET, d.f.W, MSBET, and…arrow_forwardWild irises are beautiful flowers found throughout the United States, Canada, and northern Europe. This problem concerns the length of the sepal (leaf-like part covering the flower) of different species of wild iris. Data are based on information taken from an article by R. A. Fisher in Annals of Eugenics (Vol. 7, part 2, pp. 179 -188). Measurements of sepal length in centimeters from random samples of Iris setosa (I), Iris versicolor (II), and Iris virginica (III) are as follows below. I II III 5.5 5.2 6.8 4.6 6.5 5.3 5.1 6.1 4.4 5.5 4.1 7.9 4.1 5.1 5.9 5.4 6.1 6.9 5.4 5.1 6.6 Shall we reject or not reject the claim that there are no differences among the population means of sepal length for the different species of iris? Use a 5% level of significance. (a) What is the level of significance?State the null and alternate hypotheses. Ho: ?1 = ?2 = ?3; H1: Exactly two means are equal.Ho: ?1 = ?2 = ?3; H1: Not all the means are equal. Ho: ?1 = ?2 = ?3; H1:…arrow_forwardWild irises are beautiful flowers found throughout the United States, Canada, and northern Europe. This problem concerns the length of the sepal (leaf-like part covering the flower) of different species of wild iris. Data are based on information taken from an article by R. A. Fisher in Annals of Eugenics (Vol. 7, part 2, pp. 179 -188). Measurements of sepal length in centimeters from random samples of Iris setosa (I), Iris versicolor (II), and Iris virginica (III) are as follows below. I II III 5.7 5.4 6.8 4.1 6.3 5.4 5.0 6.7 4.4 5.4 4.3 7.3 4.6 5.5 5.3 5.7 6.5 6.7 5.2 5.3 6.8 Shall we reject or not reject the claim that there are no differences among the population means of sepal length for the different species of iris? Use a 5% level of significance. (a) What is the level of significance?State the null and alternate hypotheses. Ho: ?1 = ?2 = ?3; H1: All three means are different.Ho: ?1 = ?2 = ?3; H1: Not all the means are equal. Ho: ?1 = ?2 = ?3;…arrow_forward
- Wild irises are beautiful flowers found throughout the United States, Canada, and northern Europe. This problem concerns the length of the sepal (leaf-like part covering the flower) of different species of wild iris. Data are based on information taken from an article by R. A. Fisher in Annals of Eugenics (Vol. 7, part 2, pp. 179 -188). Measurements of sepal length in centimeters from random samples of Iris setosa (I), Iris versicolor (II), and Iris virginica (III) are as follows below. I II III 5.7 5.1 6.5 4.7 6.2 5.1 4.7 6.6 4.7 5.8 4.9 7.5 4.6 5.2 5.3 5.3 6.2 6.2 5.4 5.8 6.4 (b) Find SSTOT, SSBET, and SSW and check that SSTOT = SSBET + SSW. (Use 3 decimal places.) SSTOT = SSBET = SSW = Find d.f.BET, d.f.W, MSBET, and MSW. (Use 4 decimal places for MSBET, and MSW.) dfBET = dfW = MSBET = MSW = Find the value of the sample F statistic. (Use 2 decimal places.)What are the degrees of freedom? (numerator) (denominator)arrow_forwardWild irises are beautiful flowers found throughout the United States, Canada, and northern Europe. This problem concerns the length of the sepal (leaf-like part covering the flower) of different species of wild iris. Data are based on information taken from an article by R. A. Fisher in Annals of Eugenics (Vol. 7, part 2, pp. 179 -188). Measurements of sepal length in centimeters from random samples of Iris setosa (I), Iris versicolor (II), and Iris virginica (III) are as follows below. I II III 5.9 5.8 6.9 4.8 6.5 5.6 4.6 6.4 4.9 5.7 4.3 7.7 4.8 5.8 5.6 5.4 6.3 6.3 5.8 5.5 6.6 Shall we reject or not reject the claim that there are no differences among the population means of sepal length for the different species of iris? Use a 5% level of significance. (b) Find SSTOT, SSBET, and SSW and check that SSTOT = SSBET + SSW. (Use 3 decimal places.) SSTOT = SSBET = SSW = Find d.f.BET, d.f.W, MSBET, and MSW. (Use 4 decimal places for MSBET, and…arrow_forwardWild irises are beautiful flowers found throughout the United States, Canada, and northern Europe. This problem concerns the length of the sepal (leaf-like part covering the flower) of different species of wild iris. Data are based on information taken from an article by R. A. Fisher in Annals of Eugenics (Vol. 7, part 2, pp. 179 -188). Measurements of sepal length in centimeters from random samples of Iris setosa (I), Iris versicolor (II), and Iris virginica (III) are as follows below. I II III 5.6 5.5 6.9 4.5 6.6 5.5 5.4 6.5 4.3 5.4 4.6 7.9 4.7 5.6 5.8 5.9 6.6 6.3 5.6 5.6 6.9 Shall we reject or not reject the claim that there are no differences among the population means of sepal length for the different species of iris? (b) Find SSTOT, SSBET, and SSW and check that SSTOT = SSBET + SSW. (Use 3 decimal places.) SSTOT = SSBET = SSW = Find d.f.BET, d.f.W, MSBET, and MSW. (Use 4 decimal places for MSBET, and MSW.) dfBET = dfW =…arrow_forward
- CONSIDER that the data is UNCORRELATED use alpha .05. Provide the following: 1. CI of the F value 2. Statistical Interpretationarrow_forwardA paper investigated the driving behavior of teenagers by observing their vehicles as they left a high school parking lot and then again at a site approximately 1 2 mile from the school. Assume that it is reasonable to regard the teen drivers in this study as representative of the population of teen drivers. Amount by Which Speed Limit Was Exceeded MaleDriver FemaleDriver 1.3 -0.1 1.3 0.4 0.9 1.1 2.1 0.7 0.7 1.1 1.3 1.2 3 0.1 1.3 0.9 0.6 0.5 2.1 0.5 (a) Use a .01 level of significance for any hypothesis tests. Data consistent with summary quantities appearing in the paper are given in the table. The measurements represent the difference between the observed vehicle speed and the posted speed limit (in miles per hour) for a sample of male teenage drivers and a sample of female teenage drivers. (Use μmales − μfemales.Round your test statistic to two decimal places. Round your degrees of freedom down to the nearest whole number. Round your p-value to…arrow_forwardThe accompanying data set consists of observationson shower-flow rate (L/min) for a sample of n 5 129houses in Perth, Australia (“An Application of BayesMethodology to the Analysis of Diary Records in aWater Use Study,” J. Amer. Stat. Assoc., 1987:705–711):4.6 12.3 7.1 7.0 4.0 9.2 6.7 6.9 11.5 5.111.2 10.5 14.3 8.0 8.8 6.4 5.1 5.6 9.6 7.57.5 6.2 5.8 2.3 3.4 10.4 9.8 6.6 3.7 6.48.3 6.5 7.6 9.3 9.2 7.3 5.0 6.3 13.8 6.25.4 4.8 7.5 6.0 6.9 10.8 7.5 6.6 5.0 3.37.6 3.9 11.9 2.2 15.0 7.2 6.1 15.3 18.9 7.25.4 5.5 4.3 9.0 12.7 11.3 7.4 5.0 3.5 8.28.4 7.3 10.3 11.9 6.0 5.6 9.5 9.3 10.4 9.75.1 6.7 10.2 6.2 8.4 7.0 4.8 5.6 10.5 14.610.8 15.5 7.5 6.4 3.4 5.5 6.6 5.9 15.0 9.67.8 7.0 6.9 4.1 3.6 11.9 3.7 5.7 6.8 11.39.3 9.6 10.4 9.3 6.9 9.8 9.1 10.6 4.5 6.28.3 3.2 4.9 5.0 6.0 8.2 6.3 3.8 6.0 b. What is a typical, or representative, flow rate?arrow_forward
- The accompanying data set consists of observationson shower-flow rate (L/min) for a sample of n 5 129houses in Perth, Australia (“An Application of BayesMethodology to the Analysis of Diary Records in aWater Use Study,” J. Amer. Stat. Assoc., 1987:705–711):4.6 12.3 7.1 7.0 4.0 9.2 6.7 6.9 11.5 5.111.2 10.5 14.3 8.0 8.8 6.4 5.1 5.6 9.6 7.57.5 6.2 5.8 2.3 3.4 10.4 9.8 6.6 3.7 6.48.3 6.5 7.6 9.3 9.2 7.3 5.0 6.3 13.8 6.25.4 4.8 7.5 6.0 6.9 10.8 7.5 6.6 5.0 3.37.6 3.9 11.9 2.2 15.0 7.2 6.1 15.3 18.9 7.25.4 5.5 4.3 9.0 12.7 11.3 7.4 5.0 3.5 8.28.4 7.3 10.3 11.9 6.0 5.6 9.5 9.3 10.4 9.75.1 6.7 10.2 6.2 8.4 7.0 4.8 5.6 10.5 14.610.8 15.5 7.5 6.4 3.4 5.5 6.6 5.9 15.0 9.67.8 7.0 6.9 4.1 3.6 11.9 3.7 5.7 6.8 11.39.3 9.6 10.4 9.3 6.9 9.8 9.1 10.6 4.5 6.28.3 3.2 4.9 5.0 6.0 8.2 6.3 3.8 6.0 a. Construct a stem-and-leaf display of the data.b. What is a typical, or representative, flow rate?c. Does the display appear to be highly concentrated orspread out?d. Does the distribution of values appear to…arrow_forwardA paper investigated the driving behavior of teenagers by observing their vehicles as they left a high school parking lot and then again at a site approximately 1 2 mile from the school. Assume that it is reasonable to regard the teen drivers in this study as representative of the population of teen drivers. Amount by Which Speed Limit Was Exceeded MaleDriver FemaleDriver 1.2 -0.1 1.4 0.4 0.9 1.1 2.1 0.7 0.7 1.1 1.3 1.2 3 0.1 1.3 0.9 0.6 0.5 2.1 0.5 (a) Use a .01 level of significance for any hypothesis tests. Data consistent with summary quantities appearing in the paper are given in the table. The measurements represent the difference between the observed vehicle speed and the posted speed limit (in miles per hour) for a sample of male teenage drivers and a sample of female teenage drivers. (Use μmales − μfemales.Round your test statistic to two decimal places. Round your degrees of freedom down to the nearest whole number. Round your p-value to…arrow_forwardYou obtained the following raw data when setting up a Biuret standard curve: BSA (mg/ml) Absorbancy 540nm 0 0.158 1 0.210 2 0.260 3 0.305 4 0.360 5 0.410 6 0.455 7 0.510 8 0.530 9 0.550 10 0.554 What would the quality of the line-fit (R2 value) be if you do not exclude experimental outliers? (Give you answer to 4 decimal places)arrow_forward
arrow_back_ios
SEE MORE QUESTIONS
arrow_forward_ios
Recommended textbooks for you
 MATLAB: An Introduction with ApplicationsStatisticsISBN:9781119256830Author:Amos GilatPublisher:John Wiley & Sons Inc
 Probability and Statistics for Engineering and th...StatisticsISBN:9781305251809Author:Jay L. DevorePublisher:Cengage Learning
 Statistics for The Behavioral Sciences (MindTap C...StatisticsISBN:9781305504912Author:Frederick J Gravetter, Larry B. WallnauPublisher:Cengage Learning
 Elementary Statistics: Picturing the World (7th E...StatisticsISBN:9780134683416Author:Ron Larson, Betsy FarberPublisher:PEARSON
 The Basic Practice of StatisticsStatisticsISBN:9781319042578Author:David S. Moore, William I. Notz, Michael A. FlignerPublisher:W. H. Freeman
 Introduction to the Practice of StatisticsStatisticsISBN:9781319013387Author:David S. Moore, George P. McCabe, Bruce A. CraigPublisher:W. H. Freeman
MATLAB: An Introduction with Applications
Statistics
ISBN:9781119256830
Author:Amos Gilat
Publisher:John Wiley & Sons Inc
Probability and Statistics for Engineering and th...
Statistics
ISBN:9781305251809
Author:Jay L. Devore
Publisher:Cengage Learning
Statistics for The Behavioral Sciences (MindTap C...
Statistics
ISBN:9781305504912
Author:Frederick J Gravetter, Larry B. Wallnau
Publisher:Cengage Learning
Elementary Statistics: Picturing the World (7th E...
Statistics
ISBN:9780134683416
Author:Ron Larson, Betsy Farber
Publisher:PEARSON
The Basic Practice of Statistics
Statistics
ISBN:9781319042578
Author:David S. Moore, William I. Notz, Michael A. Fligner
Publisher:W. H. Freeman
Introduction to the Practice of Statistics
Statistics
ISBN:9781319013387
Author:David S. Moore, George P. McCabe, Bruce A. Craig
Publisher:W. H. Freeman
Introduction to experimental design and analysis of variance (ANOVA); Author: Dr. Bharatendra Rai;https://www.youtube.com/watch?v=vSFo1MwLoxU;License: Standard YouTube License, CC-BY